Tag: sony

  • SONY 70th Birthday: Happy Birthday SONY!

    SONY 70th Birthday: Happy Birthday SONY!

    Today: by far the strongest profits are not from electronics or Playstation, but from the subsidiary SONY Financial Holdings Inc within Japan

    SONY 70th Birthday: Tokyo Tsushin Kogyo (Totsuko) was founded on May 7, 1946

    SONY celebrates 70th Birthday today – SONY’s predecessor Tokyo Tsushin Kogyo (東京通信工業株式会社), Totsuko (東通工) was founded on May 7, 1946 by:

    following preparations going back to 1945.

    Outside Japan there is a tendency to focus on one of the two co-founders, Akio Morita, however, as an engineer Masaru Ibuka was as least as important a co-founder.

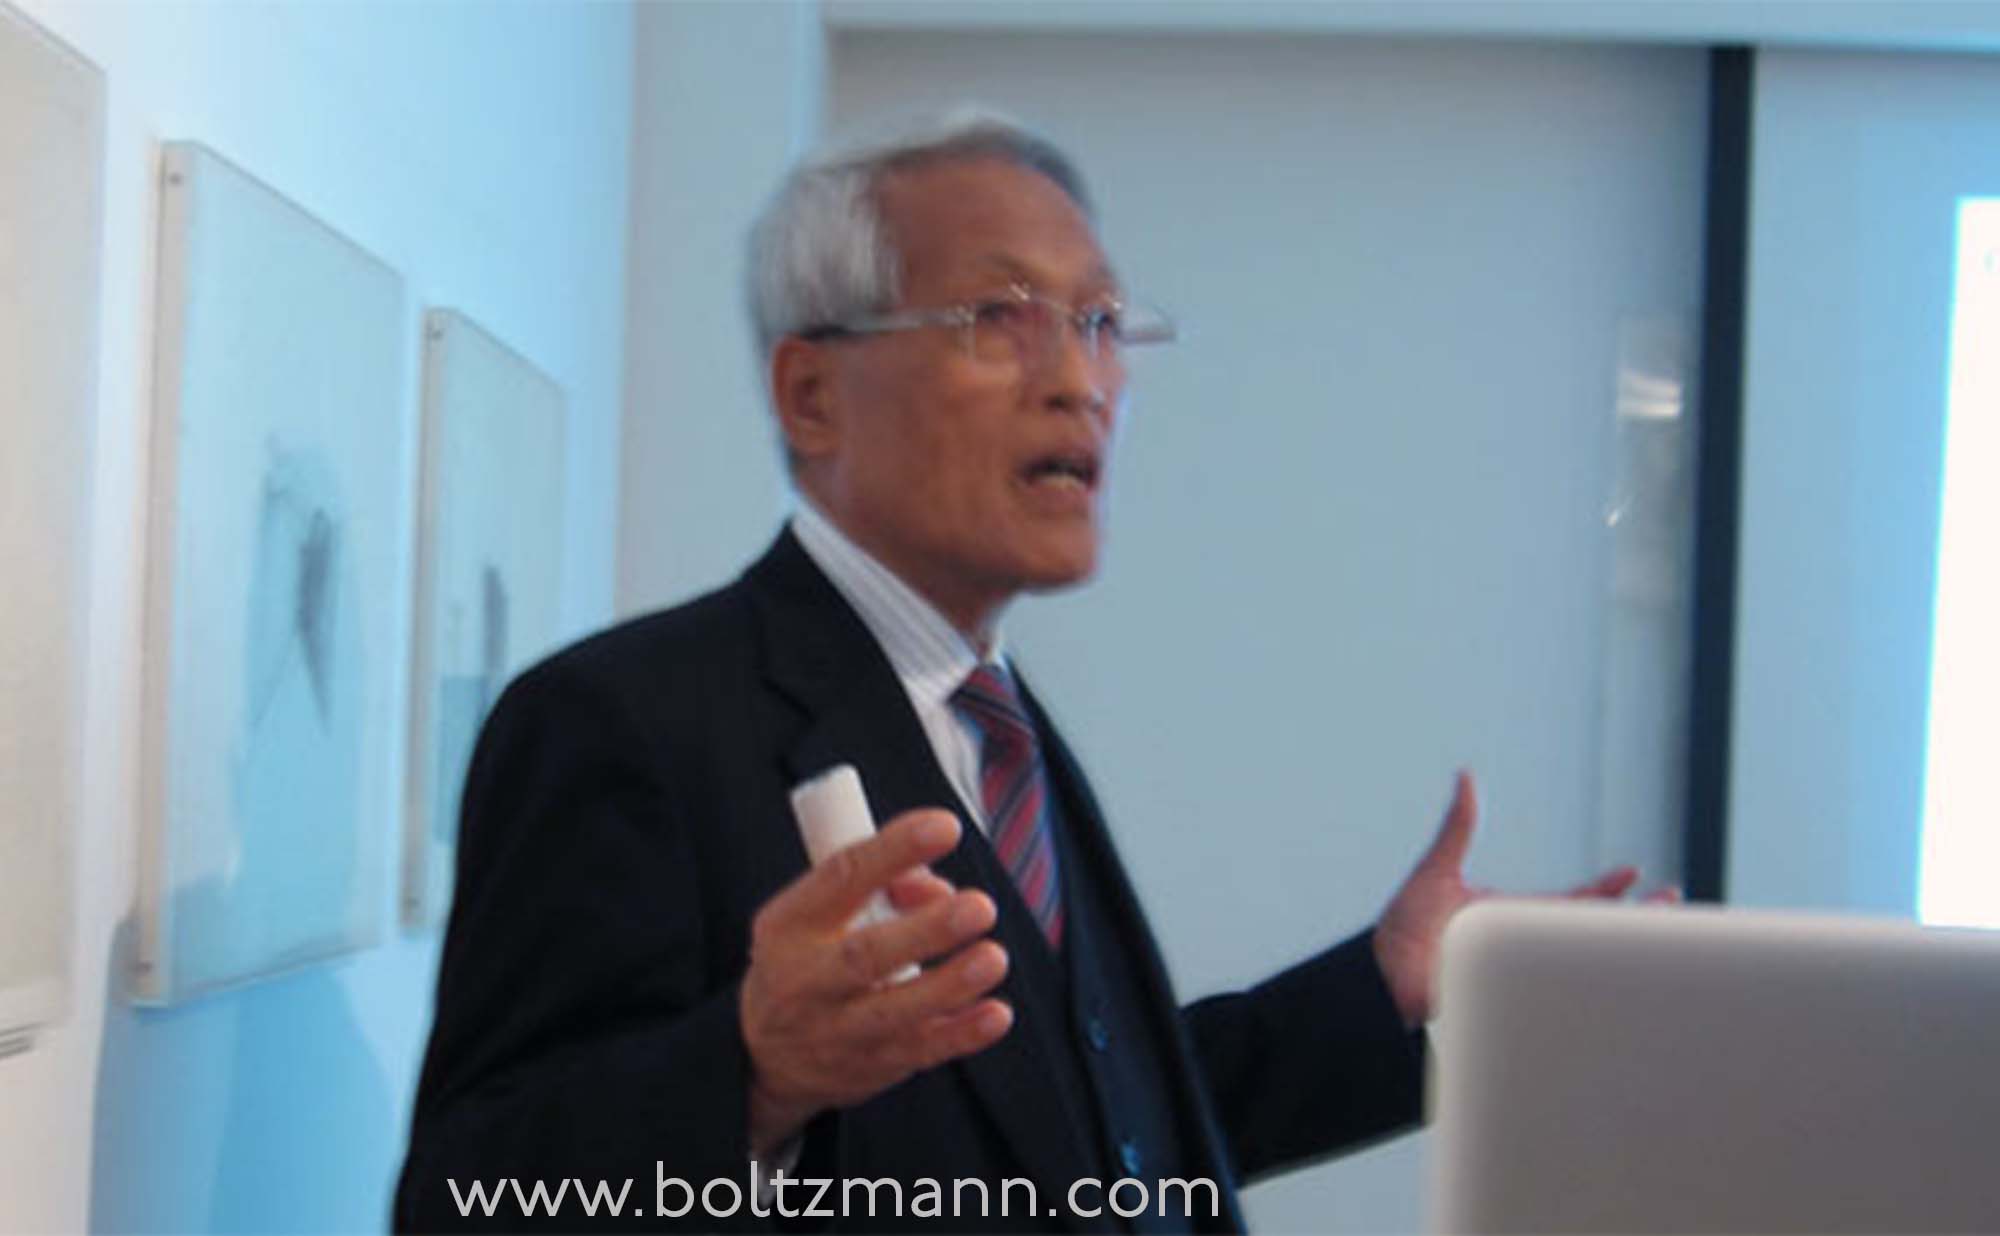
    Masaru Ibuka (井深大), co-founder

    Masaru Ibuka (井深大) was a passionate engineer, and drove much of the technical product development, recruiting and leading some of the best engineers.

    Read Masaru Ibuka’s obituary in NATURE here: “Obituary: Masaru Ibuka (1908-97). Electrical engineer and co-founder of SONY” by Gerhard Fasol.

    Read also: Masaru Ibuka, Founder of SONY, Obituary for NATURE

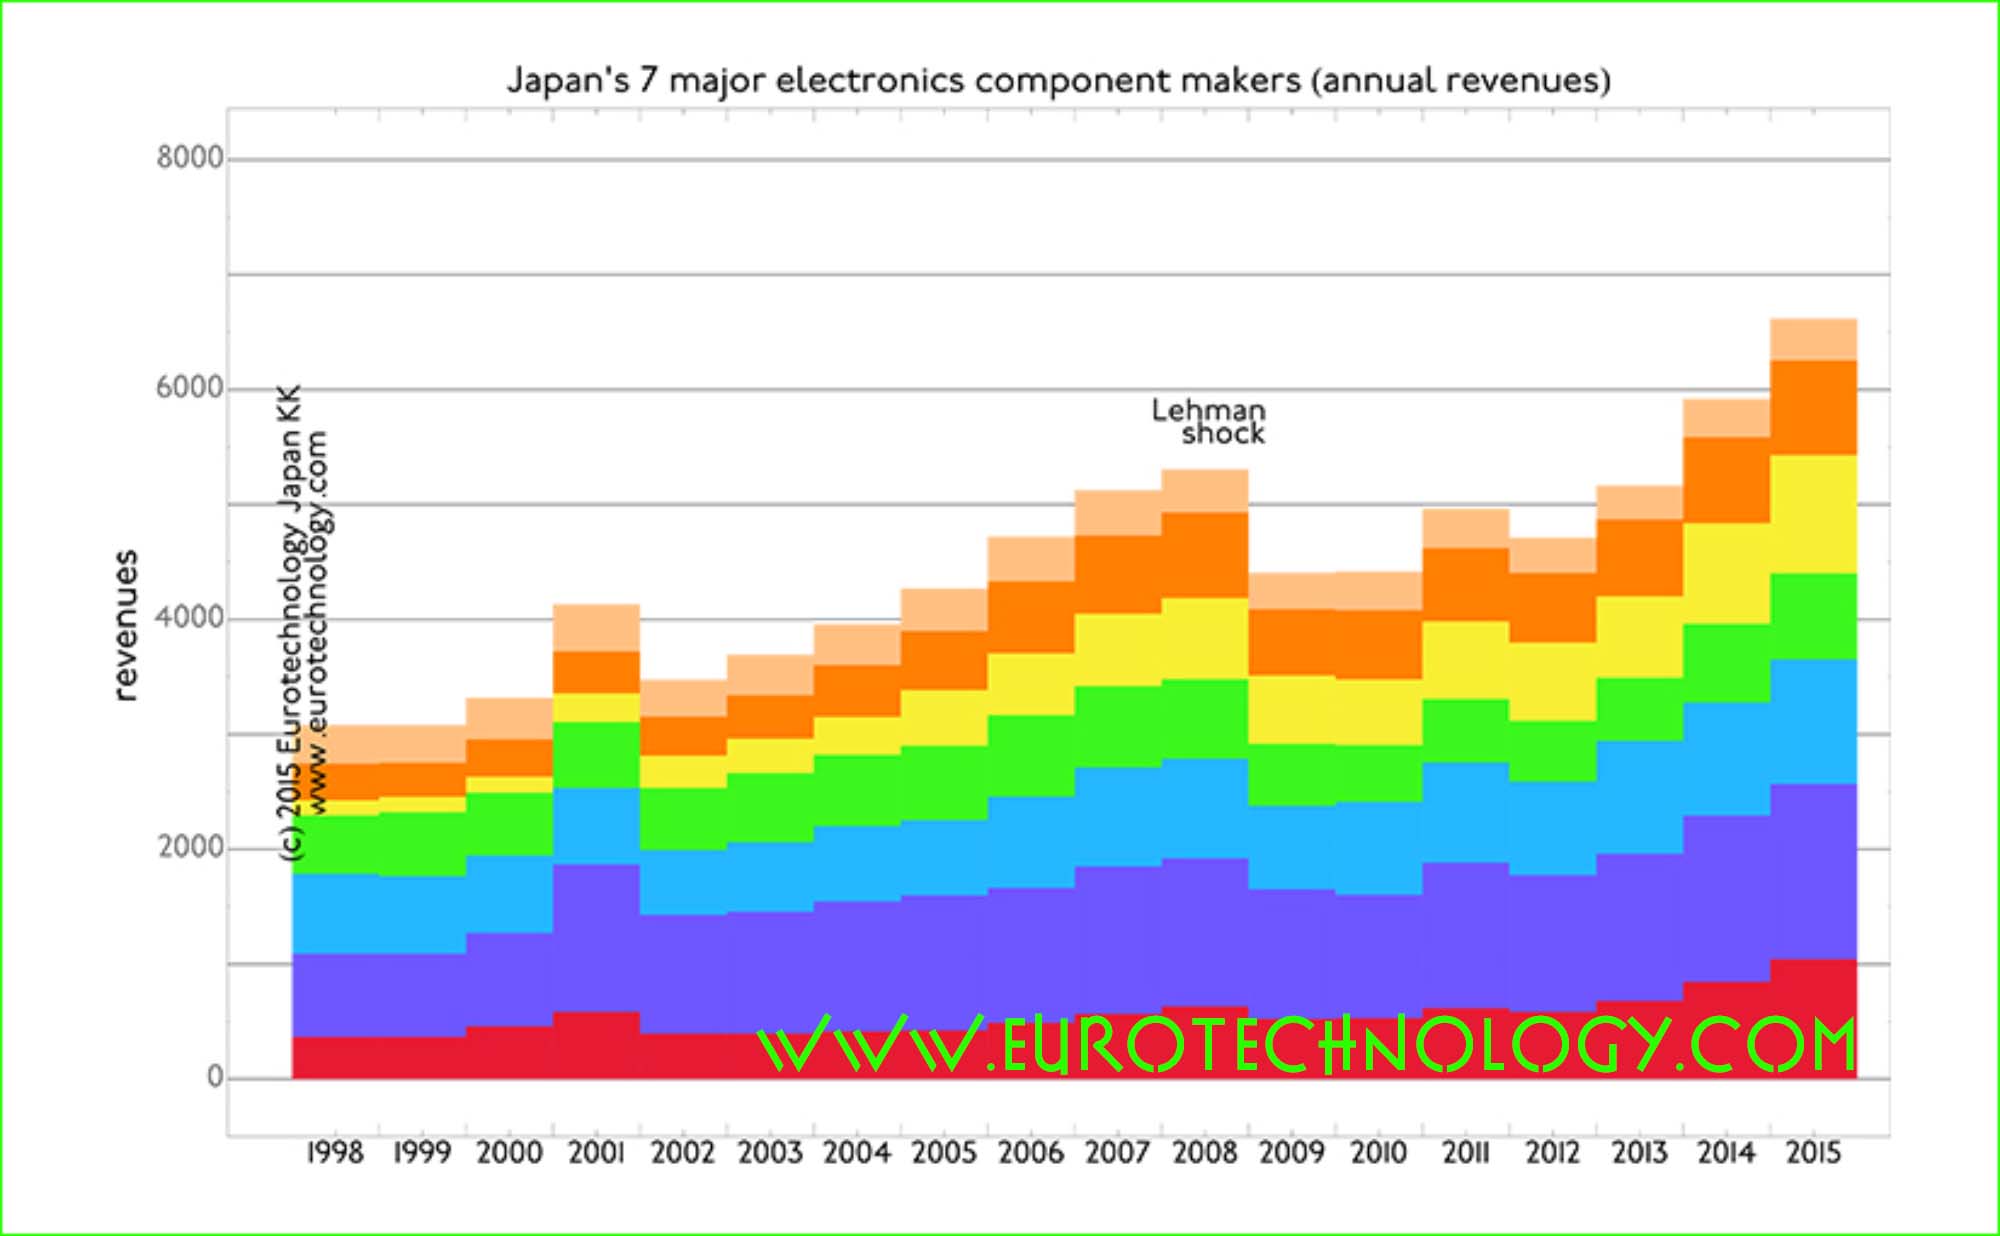
    SONY over the most recent 18 years (1998-2016)

    compound annual growth rate (CAGR) = 1.0% over the last 18 years

    Essentially, over the last 18 years (FY ending March 31, 1998 – FY ending March 31, 2016), SONY’s revenues=sales have been stable, growing on average 1% per year.

    SONY's revenues/sales grow at an average compound annual growth rate (CAGR) of 1.0% over the 18 years from FY1998-FY2016
    SONY’s revenues/sales grow at an average compound annual growth rate (CAGR) of 1.0% over the 18 years from FY1998-FY2016

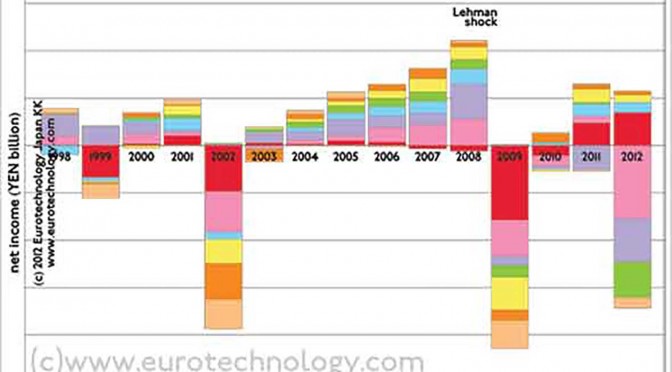
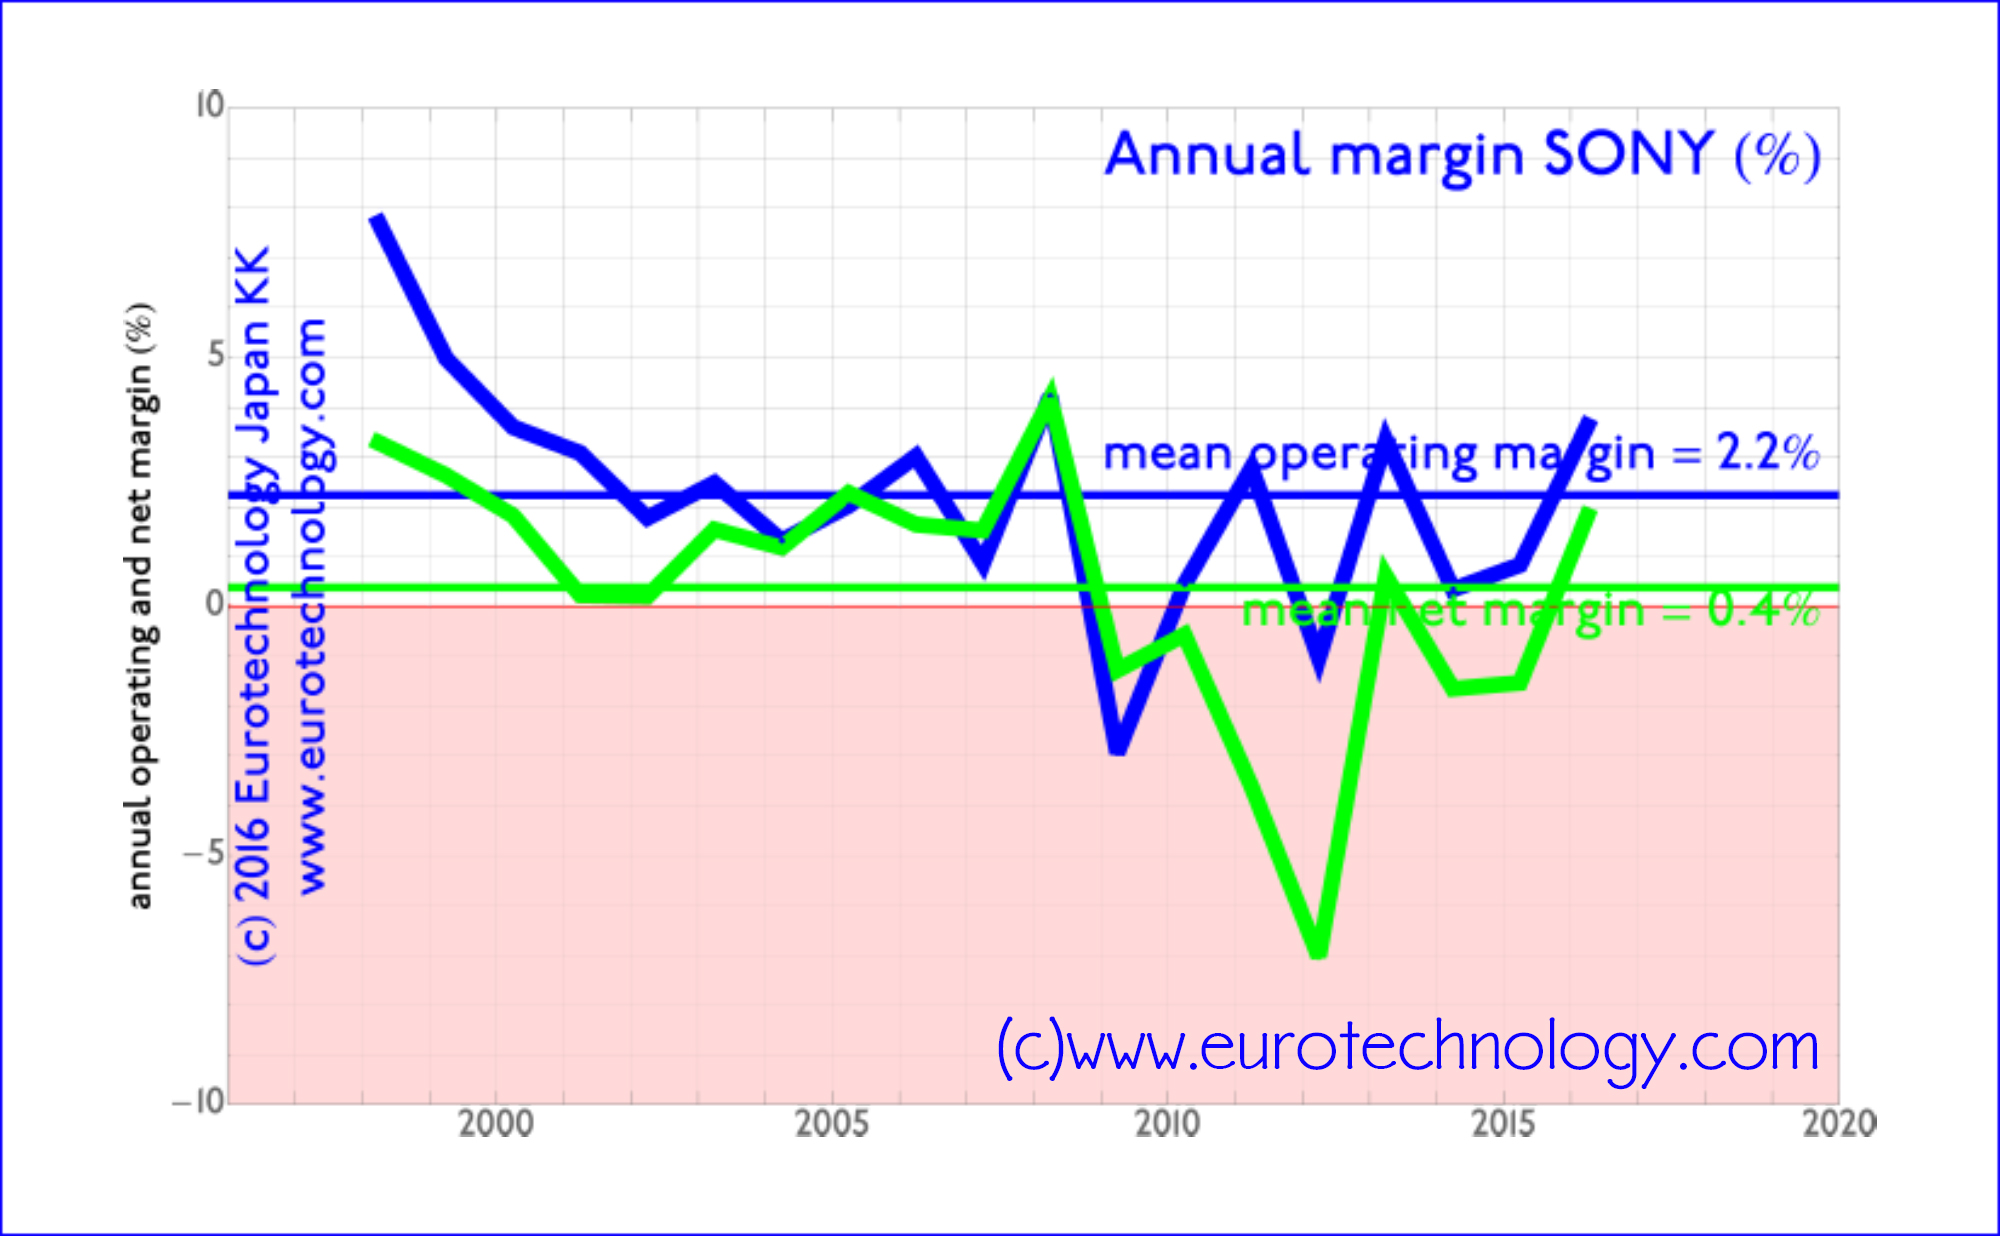
    net income/profit margin = 0.4% over the last 18 years

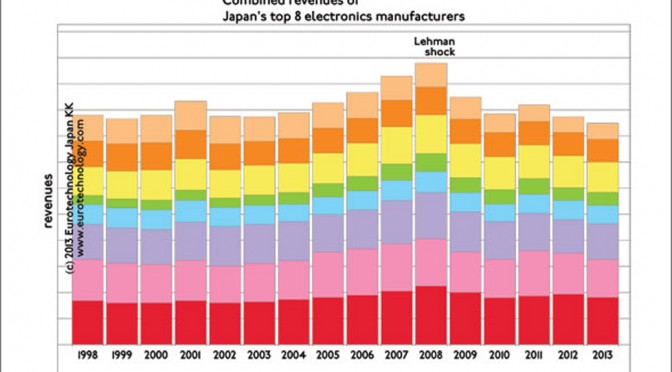
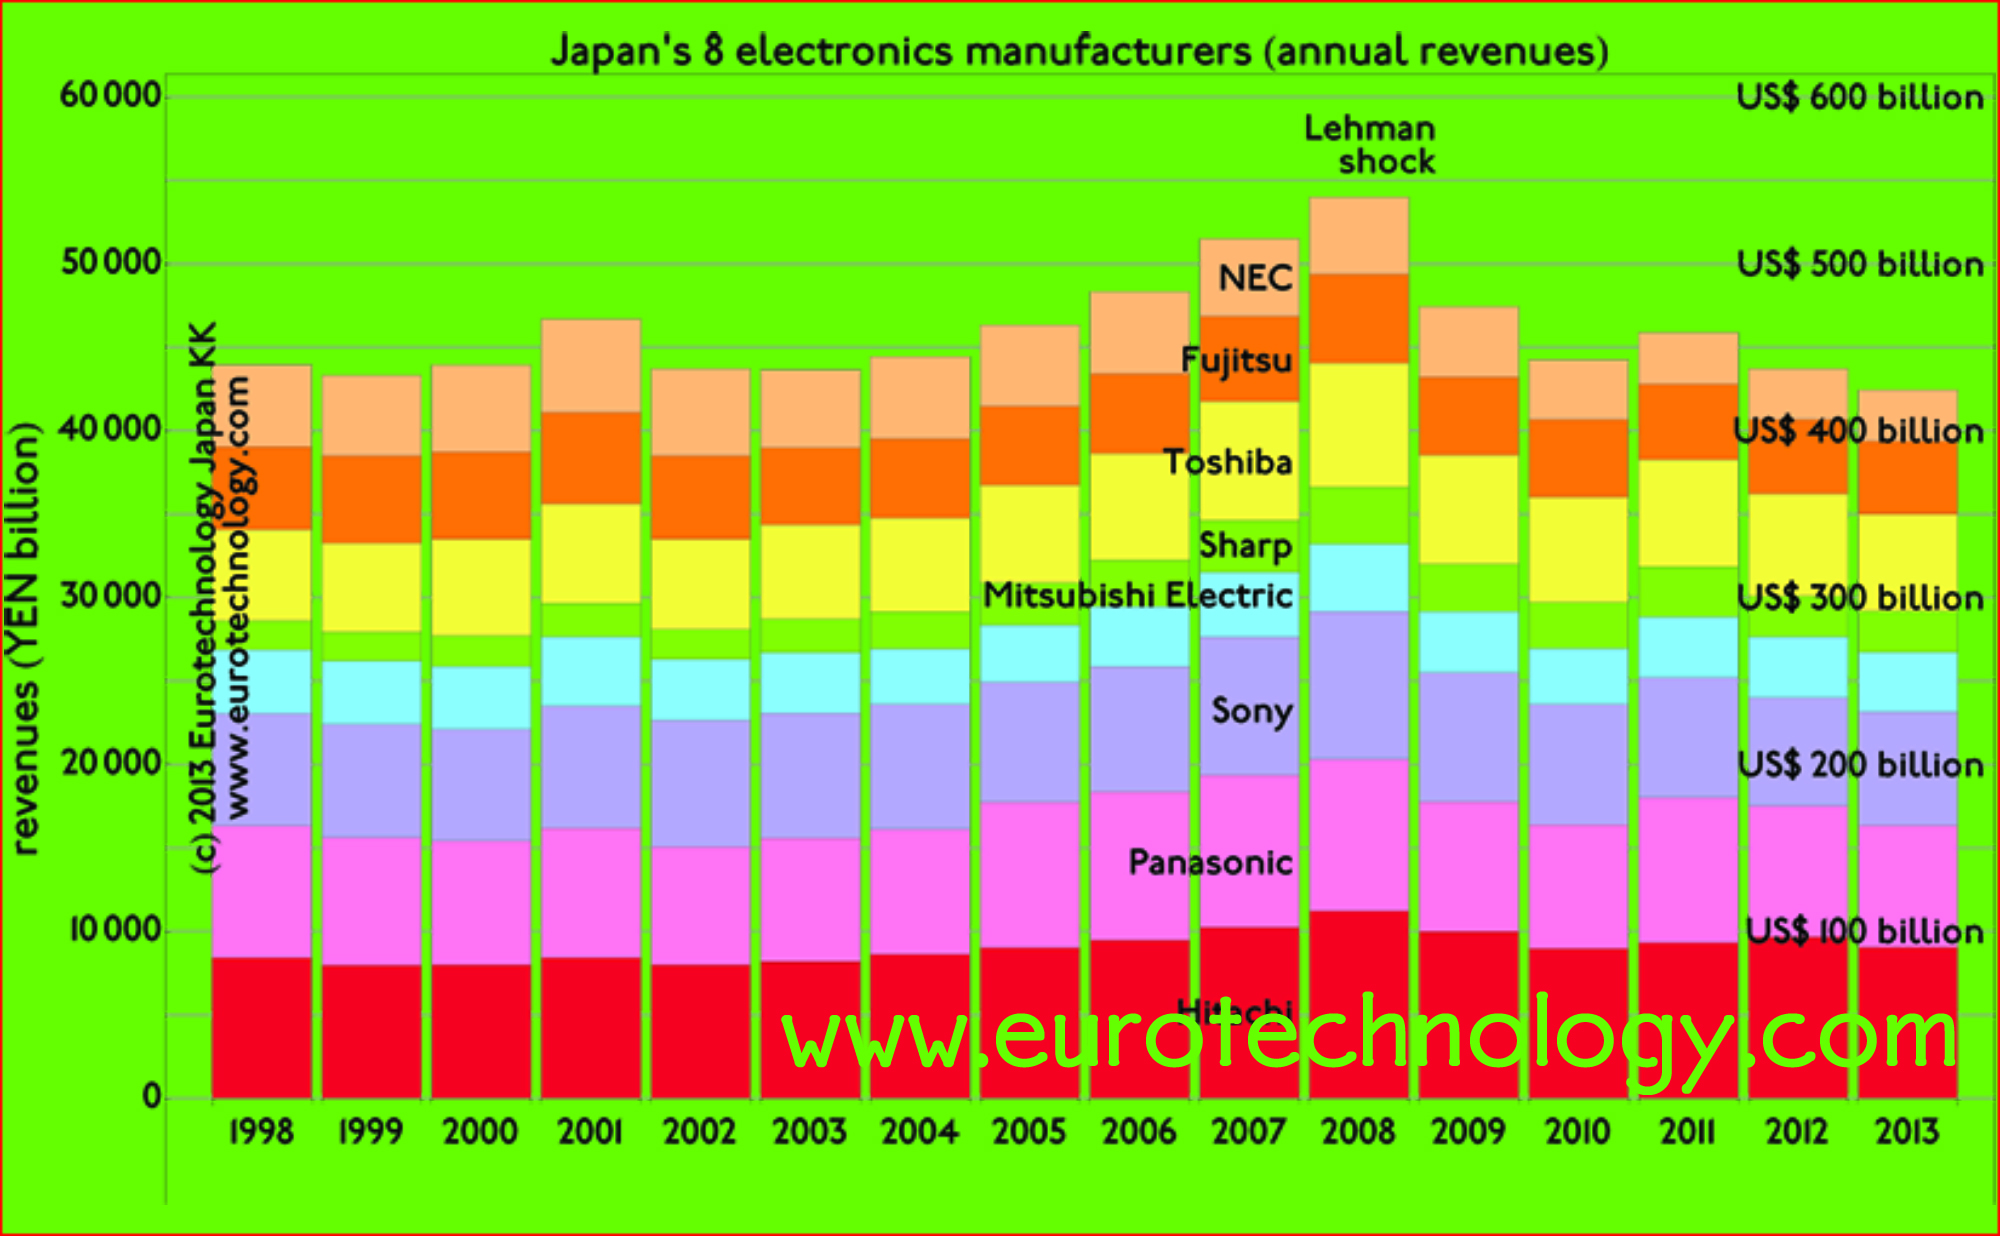
    Net income/profits have been 0.4% (approximately zero) averaged over these 18 years – as is characteristic for Japan’s top 8 electronics multinationals.

    Back in the days of Trinitron vacuum tube TVs and mechanical Walkman tape recorders, SONY’s products could command relatively high profit margins, the falling edge can be seen in the Figure below: gross profit margins were as high as 8% back in 1998, and net profit margins as high as 3% of sales. However, averaged over the last 18 years, net profit margins average about 0.4%.

    SONY's average net income/profit margin over the last 18 years has been very close to zero.
    SONY’s average net income/profit margin over the last 18 years has been very close to zero.

    SONY’s subsidiary “SONY Financial Holdings Inc” (60% owned by SONY) is by far the most profitable division of SONY

    SONY publishes detailed reports of operating profits for its different divisions, showing that by far the most profitable division are Financial Services, which are not an integral part of the SONY Corporation (ソニー株式会社), but a partly (60%) owned and separately managed subsidiary SONY Financial Holdings Inc (ソニーフィナンシャルホールディングス株式会社).

    In the latest financial report for the Financial Year ending March 31, 2016, SONY Finance has twice as much income/profit as the next most profitable divisions – SONY’s Financial Services (mainly offering credit card and banking services inside Japan) are and have been by far the most profitable division of SONY for many years.

    SONY Financial Holdings Inc (ソニーフィナンシャルホールディングス株式会社) is a subsidiary of SONY, and is independently listed on the Tokyo Stock Exchange [TSE Code 8729], was founded on April 1, 2004, and IPO was on Oct 11, 2007. SONY owns 60% of SONY Financial Holdings Inc’s shares.

    Our report: “Japan electronics industries – mono zukuri”

    Register and receive an email with a link to a free trial version of our report on “Japan electronics industries” and our newsletters.

    Purchase a copy of the report online here.

    Copyright 2016 Eurotechnology Japan KK All Rights Reserved

  • Japanese electronics parts makers grow, while Japan’s iconic electronics makers stagnate

    Japanese electronics parts makers grow, while Japan’s iconic electronics makers stagnate

    by Gerhard Fasol

    Japan’s iconic electronics groups combined are of similar size as the economy of The Netherlands

    Parts makers’ sales may overtake iconic electronics groups in the near future – they have already in terms of profits

    In our analysis of Japan’s electronic industries we compare the top 8 iconic electronics groups with top 7 electronics parts makers over the period FY1998 to FY2014, which ended March 31, 2015 for most Japanese companies. Except for Toshiba, all Japanese major electronics companies have now officially reported their FY2014 results.

    Japan’s iconic 8 electronics groups (Hitachi, Toshiba, Panasonic, Fujitsu, Mitsubishi Electric, NEC, SONY and SHARP) combined are as large as the economy of The Netherlands – but while the economy of The Netherlands doubled in size between 1998 and 2015, the sales/revenues of Japan’s iconic 8 electronics groups combined showed almost zero growth (annual compound growth rate = 0.4%) and almost zero income (profits).

    Japan’s top 7 electronics parts makers on the other hand – similar to the Netherlands – more than doubled their combined revenues (sales) over the 17 years from FY1998 to FY2014, and earned healthy and increasing profits.

    While several of Japan’s iconic electronics groups are fighting for survival, Japan’s parts makers have very ambitious growth plans – some of them may well overtake the traditional electronics conglomerates in sales – they have already in terms of profits. And they aggressively acquire around the world.

    Detailed data and analysis in our Report on Japan’s electronics sector

    Japan’s electronics parts makers combined more than doubled sales over the last 17 years

    Japan's top 7 electronics parts makers grow at CAGR of 4.6%
    Japan’s top 7 electronics parts makers grow at CAGR of 4.6%

    Japan’s iconic top 8 electronics groups showed almost no growth over the last 17 years

    Japan's top 8 iconic electronics groups stagnate - some fight for survival
    Japan’s top 8 iconic electronics groups stagnate – some fight for survival

    Japan’s electronics parts makers grow – the traditional electronics groups stagnate

    Japan's electronics parts makers grow - Japan's iconic electronics groups stagnate
    Japan’s electronics parts makers grow – Japan’s iconic electronics groups stagnate

    Japan electronics industries – mono zukuri

    Copyright 2009-2019 Eurotechnology Japan KK All Rights Reserved

  • JVC KENWOOD Chairman: “Speed is like fresh food” – Revitalization of Japanese industry by JVC KENWOOD Chairman Haruo Kawahara (6th Ludwig Boltzmann Symposium)

    JVC KENWOOD Chairman: “Speed is like fresh food” – Revitalization of Japanese industry by JVC KENWOOD Chairman Haruo Kawahara (6th Ludwig Boltzmann Symposium)

    JVC Kenwood Chairman Haruo Kawahara: Revitalization of Japanese Industry

    (Representative Director and Chairman of the Board of JVC KENWOOD Corporation)

    Keynote presented at the 6th Ludwig Boltzmann Symposium on February 20, 2014 at the Embassy of Austria in Tokyo.

    Background reading:

    JVC KENWOOD Corporation was incorporated on October 1, 2008, and has 20,033 employees as of October 1, 2013.

    KENWOOD corporate vision: Creating excitement and peace of mind for the people of the world

    KENWOOD overview

    Total sales for fiscal year ending March 2013 was YEN 306.6 Billion (approx. US$ 3 Billion).

    JVC KENWOOD today has four business divisions:

    • Car Electronics (CE): 33% of total sales
      • car navigation systems
      • car audio systems
      • CD/DVD drive mechanisms
      • optical pick-ups
    • Professional Systems (PS): 30%
      • digital land mobile radio
      • amateur radio
      • security cameras
      • professional video cameras
      • emergency broadcasting equipment
    • Optical & Audio (O&A): 22%
      • action camera
      • home audio systems
      • all-in one tower design audio systems
      • camcorder with wifi
      • 4K projektor
      • headphones
    • Entertainment Software (SE): 13%
      • Victor Entertainment Group
      • Teichiku Entertainment

    Issues of the electrical industry of Japan:

    • 1970s: overwhelmed with vertical integration and self-sufficiency
    • 1980s: appreciation of the yen (1985 Plaza Accord)
    • 1990s: collapse of the Bubble (1991), relocation of production to Asia, three excesses:
      • debt
      • facility
      • employment
    • 2000s: lost 20 years

    Going forward, Japan has the option of growth under new business models, or continue to stagnate with matured industries

    While there is dramatic global market expansion in many business areas in the global electrical industry, e.g. for Lithium Ion Batteries, DVDs, Car navigation units, DRAM, Japan’s market shares are falling in most sectors. For example, Japanese market shares for LCD, DVD players, Lithium Ion batteries, or car navigation units have fallen from almost 100% global market share 5-10 years ago to 10%-20% today.

    Restructuring mature industry can generate more economic benefit than innovating a new industry:

    • large established market, although low growth
    • reduced number of players in the market following consolidation

    Revitalization of JVCKENWOOD

    • the current main business as the core – not new business
    • speed, like “fresh food”
    • eliminate hidden waste and loss costs
    • eliminate vested rights

    Kenwood in 2002 was in a disastrous condition:

    • net income (loss): YEN -27 Billion (= US$ -270 million) losses
    • debt: YEN 110 Billion (= US$ 1.1 billion)
    • accumulated losses: YEN 45 Billion (= US$ 450 million)
    • net worth: YEN -17 Billion (= US$ -170 million)

    Restructuring by March 2003:

    1. Financial restructuring: Dept/equity swap. Moved from YEN 17 billion negative net worth to positive within 6 months
    2. Business restructuring: focus on core business. Terminated cellular phone business.
    3. Cost restructuring: 30% cost reduction. Closed 3 factories. Voluntary retirement.
    4. Management restructuring: management consolidation. Eliminate huge wastes and losses in subsidiaries.

    Restructuring in FY2003 achieved a V-shape recovery. Net income margin was improved from -8% in FY3/2002 to 2%-4% in recent years.

    In mature markets, growth is achieved through M&A, reducing the number of players in the market. As the top player in the market, profitable growth improved:

    Main four players in the car electronics after-market before Kenwood-JVC merger:

    1. Pioneer
    2. Kenwood
    3. Sony
    4. JVC

    after the JVCKENWOOD merger, and restructure to minimize losses from the TV business:

    1. JVCKENWOOD

    JVC and KENWOOD formed a capital and business alliance in July 2007, followed by management integration in October 2008, and a full merger in October 2011. The business portfolio was restructured, and in particular big losses in the TV business were reduced. Fixed costs were reduced by 40% by selling off assets, reduction of production and sales sites, and 25% voluntary retirement.

    This structural reform was completed in the FY3/2001, and led to another V-shaped recovery, and to profitable growth under the new medium term business plan.

    The JVC-KENWOOD merger led to big jumps in market share in many markets, and thus to very much improved profitability.

    How can Japan become competitive again?

    Why did Japan’s mass production type electronics fail? Answer: Japanese management failed to deal with globalization and digitalization.

    Other factors that contributed to Japan’s failure are vertical integration, technology leakage from exporting production facilities, insufficient added value compared to the high Japanese labor costs, and lack of money for investment, because Japanese companies largely relied on bank loans instead of equity.

    Japan’s heavy electrical industry on the other hand is competitive – why?

    1. Creative know-how in the heavy electrical industry is in human brains, therefore more difficult to leak to competitors under Japan’s employment circumstances.
    2. huge capital investment is needed, and almost fully depreciated in Japan. Therefore the depreciation costs exceeds HR costs.

    How can Japan become competitive again?

    Japan needs to accelerate growth strategies in those areas, where Japan has competitive advantage, and where Japanese industries can differentiate themselves. Examples are industrial areas which depend on a long-term improvements and advanced technologies, and techniques of craftsmen, and in next generation technologies.

    JVC KENWOOD takes action to innovate

    • JVCKENWOOD invested in a venture capital fund: the WiL Fund I, LP to reinforce alliances with potential ventures in Japan and overseas
    • JVCKENWOOD invested in ZMP Inc. to promote car telematics and car auto-control
    Haruo Kawahara, Chairman of JVCKenwood
    Haruo Kawahara, Chairman of JVCKenwood
    Haruo Kawahara, Chairman of JVCKenwood
    Haruo Kawahara, Chairman of JVCKenwood

    Copyright (c) 2014 Eurotechnology Japan KK All Rights Reserved

  • Steve Jobs and SONY: why do Steven Jobs and SONY reach opposite answers to the same question: what to do with history?

    Steve Jobs and SONY: why do Steven Jobs and SONY reach opposite answers to the same question: what to do with history?

    Steve Jobs and SONY: why 180 degrees opposite decisions?

    Steve Jobs donates history to Stanford University in order to focus on the future

    Steve Jobs and SONY – when Steve Jobs when returned to Apple in 1996, and now SONY are faced with the same question: what to do about corporate archives and the corporate history museum? Interestingly Steve Jobs, and SONY reach exactly 180 degrees opposite answers to the same question:

    • Steve Jobs donates Apple corporate archives and company museum to Stanford University
    • SONY sells headquarters building, and keeps SONY corporate archives and company museum

    Why opposite answers to the same question? Could it be good advice for SONY, to learn from Steve Jobs, and donate SONY-Museum and SONY-Archives to a University, and focus much more on the future?

    Apple donates history collection to Stanford University:

    Steve Jobs returned to Apple with the Apple purchase of NeXT on December 10, 1996. One of the first things Steve Jobs did was to orient the Apple into the future by donating the Apple Computer Inc. Museum and historical collections to Stanford University, as documented in Stanford University’s news release dated November 18, 1997. Apple’s archives are now at Stanford University’s Silicon Valley Archives.

    Steve Jobs gave away Apple’s history documents in order to focus on the future.

    SONY sells headquarters buildings but keeps SONY Archives and SONY Corporate History Museum:

    SONY’s actions are almost exactly 180 degrees opposite to Apple’s and Steve Jobs’: according to Wallstreet Journal, The Japan News by Yomiuri, and other news sources, SONY sells the former headquarters buildings, but reports say that SONY will keep the SONY Archives and the SONY Corporate History Museum (ソニー歴史資料館).

    To understand SONY’s financial situation over the last 15 years, read our Report on Japan’s electronics industry.

    Why does Steve Jobs reach the 180 degrees opposite conclusion to SONY management when faced with the same question?

    • Is this a manifestation of Japan’s “Galapagos syndrome”?
    • Could this mean that SONY isn’t as forward looking as Steve Jobs when he returned to Apple in 1996?
    • Could it be good advice for SONY, to donate SONY-Museum and SONY-Archives to a University, and instead focus on the future?

    Japan’s electronics industry sector – research report, including SONY

    Copyright 2014 Eurotechnology Japan KK All Rights Reserved

  • Japan brand management: Saatchi & Saatchi Japan CEO Philip Rubel talks about Lovemarks in Japan

    Japan brand management: Saatchi & Saatchi Japan CEO Philip Rubel talks about Lovemarks in Japan

    Japan brand management: brands often work differently in Japan. Saatchi & Saatchi Japan CEO Philip Rubel explains Lovemarks in Japan

    Japan brand management: Saatchi & Saatchi Japan CEO Philip Rubel talks about Lovemarks in Japan
    Japan brand management: Saatchi & Saatchi Japan CEO Philip Rubel talks about Lovemarks in Japan

    by Gerhard Fasol

    Philip Rubel, CEO of Saatchi & Saatchi Fallon Tokyo KK gave a talk about “Lovemarks”, a concept in branding developed by Saatchi & Saatchi CEO Kevin Roberts.

    To understand Japan’s media landscape read the “Japan’s media” report.

    The argument is that traditional “brands” are losing relevance because in our advanced “post-industrial” societies, function and technology are given, and can usually be rapidly reproduced or overtaken by competitors. Therefore, advertising based on function or technology does not work anymore. Another factor is the shift from traditional one-way media such as TV and print, to social media and peer-to-peer interactions, where anyone can publish anything about “brands” and “brands” cannot do anything about it directly. Thus traditional brands are dead. So, how can we get people to attach irrationally, beyond reason? Lasting relationships are not based on rational thinking.

    Japan brand management: Lovemarks create loyalty which goes beyond reason

    “Lovemarks” counter these effects: the concept of Lovemarks is to “create loyalty which goes beyond reason”. To create love for the Lovemarks. To get there, Saatchi & Saatchi believes in the “unreasonable” power of creativity: creativity can create loyalty beyond reason.

    Philip Rubel showed us several examples of campaigns, mainly in Japan, which were successful far beyond expectations. These campaigns are based on creativity, incorporate surprise, appeal to emotion, and aim to exploit viral sharing on social media such as facebook and YouTube. Creativity is used to replace expensive traditional top-down one-way media such as TV and print, by social media, internet, YouTube and viral sharing and engagement. Here are some examples:

    BMW films by Fallon

    The issue was to develop the BMW brand in USA with limited budgets. BMW Films was a series of films created by famous directors and famous actors, which was uploaded to the BMWfilms.com website for download. BMW Films became famous, actors volunteered to appear, and download figures were far beyond plan.

    The Hire – Star (by BMW Films)
    BMW Films – The Hire – Beat the Devil

    SONY Bravia balls in San Francisco

    SONY Bravia bouncy balls

    Making of SONY Bravia bouncy balls

    Making of SONY Bravia bouncy balls

    SONY Bravia paint

    SONY Bravia – Paint

    Godiva Love & Hug project for Valentine’s day 2013

    For Valentine’s day 2013, Saatchi & Saatchi built a hugging robot, which people could hug, and the hugs were measured, rated, and photographed, and the results could be displayed on social network sites etc. The campaign is explained here on Saatchi & Saatchi’s website.

    Godiva Love & Hug project for Valentine’s day 2013

    https://www.facebook.com/GodivaLoveandHug

    De’Longhi coffee campaign: Michelangelo’s David

    De’Longhi had the issue of competing with much more powerful Nestle’s campaign centered on George Clooney. De’Longhi decided to use Michelangelo’s David, who is immensely popular in Japan – and who does not require actor’s fees…

    Reebok Rajio Taiso

    Radio Taiso is a morning gymnastics series, which Japan’s national radio and TV system NHK started back in 1928. Saatchi & Saatchi created an imitation of Radio Taiso using professional acrobats, and relied on viral marketing. The advertised brand name appears only very briefly at the end of the video clip – enough to create response far beyond expectations:

    Reebok Rajio Taiso

    T-Mobile “Life’s for sharing” campaign

    T-Mobile “Life’s for sharing” Royal Wedding episode currently has 27,539,402 views on YouTube:

    T-Mobile “Life’s for sharing” campaign

    Understand Japan’s media and advertising industries

    Report on Japan’s Media (approx. 200 pages, pdf file)

    Copyright 2014-2024 Eurotechnology Japan KK All Rights Reserved

  • Japan game market disruption: GungHo + DeNA + GREE overtake Japan’s game icons

    Japan game market disruption: GungHo + DeNA + GREE overtake Japan’s game icons

    Japan game market disruption: new smartphone game companies overtake Japan’s game icons like Nintendo in income

    [日本語版はこちらへ]

    Since last financial year (ended March 31, 2013), three newcomers (GungHo, DeNA, and GREE) combined achieved higher operating income and higher net income than all 9 iconic Japanese game companies (Nintendo + SONY-Games + SegaSammy + BandaiNamco + Konami + TakaraTomy + SquareEnix + Capcom + TecmoKoei) combined.

    While the newcomer’s revenues are increasing (except for GREE), the traditional 9 game companies’ revenues peaked in 2008, and have been falling rapidly ever since.

    Clearly Japan’s the 2003-2005 mergers in Japan’s game sector did not make the sector “future proof” – more dramatic changes will be either initiated by the iconic incumbents, or imposed on them from newcomers such as GungHo.

    Note that the position of foreign entrants remain weak in Japan’s game market overall.

    Read more in the article below or in our report on “Japan’s game makers and markets”, and in the following post “Brutal disruption of Japan’s Game Markets”.

    Three new game companies (GungHo, DeNA, GREE) overtake Japan's 9 iconic game companies in operating profits (note that the last data point for 2013 for GungHo is only for the first 6 months, i.e. full year results will show that the "new" game companies are doing even better compared to the "old" game companies than visible in this figure) Source: https://www.eurotechnology.com/store/jgames/
    Three new game companies (GungHo, DeNA, GREE) overtake Japan’s 9 iconic game companies in operating profits (note that the last data point for 2013 for GungHo is only for the first 6 months, i.e. full year results will show that the “new” game companies are doing even better compared to the “old” game companies than visible in this figure) Source: https://www.eurotechnology.com/store/jgames/
    Three newcomers (GungHo, DeNA, GREE) achieve higher net profits than all 9 Japanese game icons combined (note that the last data point for 2013 for GungHo is only for the first 6 months, i.e. full year results will show that the "new" game companies are doing even better compared to the "old" game companies than visible in this figure) source: https://www.eurotechnology.com/store/jgames/
    Three newcomers (GungHo, DeNA, GREE) achieve higher net profits than all 9 Japanese game icons combined (note that the last data point for 2013 for GungHo is only for the first 6 months, i.e. full year results will show that the “new” game companies are doing even better compared to the “old” game companies than visible in this figure) source: https://www.eurotechnology.com/store/jgames/

    Japan game market disruption: online and smartphone came company GungHo with Puzzle and Dragons

    GungHo started as OnSale KK, a joint-venture between SoftBank and the US company OnSale Inc., the purpose of this JV was Japan market entry for this US company, an ecommerce company.
    OnSale KK pivoted from ecommerce to games and started to distribute the Korean game Ragnarok and others, and changed its name to GungHo.
    GungHo’s breakthrough came with “Puzzle and Dragons” – Jan-June 2013 operating profits increased 4050.1% (four thousand fifty percent) compared to the same period one year ago. GungHo is part of the SoftBank group.
    More in our report on “Japan’s game makers and markets”

    Japan game market disruption: GREE

    GREE on the other hand – although a successful new venture in Japan’s game sector – is not doing so well currently: reported revenues and income have both been falling. Essentially, GREE has difficulties to implement the plan to build a global business based on their Japanese methods and business models. The factors are both “hard” and “soft”, i.e. business models, and human factors.
    Details on GREE’s performance, and reasons for GREE’s current issues in our report:

    Copyright 2013 Eurotechnology Japan KK All Rights Reserved

  • Japan game sector disruption

    Japan game sector disruption

    Japan’s iconic game companies (Nintendo, Sony, Sega-Sammy, Bandai-Namco, Konami, Takara-Tomy, Square-Enix, Capcom, Tecmo-Koei) see brutal disruption by smart phone games

    Japan game sector disruption: Three newcomers (GREE, DeNA and GungHo) achieve higher operating income than all top 9 incumbent game companies combined

    Japan’s top 9 iconic game companies, Nintendo, Sony, Sega-Sammy, Bandai-Namco, Konami, Takara-Tomy, Square-Enix, Capcom, Tecmo-Koei created much of the world’s games markets, and many of the world’s most loved game characters.

    They are now seeing brutal disruption.

    Japan game sector disruption

    With the Financial Year ending March 31, 2013, for the first time, just three Japanese newcomers (GREE, DeNA and GungHo) achieved higher operating income than all top 9 Japanese iconic incumbent game makers:

    In FY2012 combined operating income of all 9 incumbent game companies was YEN 67.6 billion (US$ 700 million), combined operating income of the 3 newcomers was YEN 174 billion (US$ 1.8 billion) – even though for GungHo only the first 6 months of 2013 are included in the calculation.

    Operating income of Japan's top 9 games companies declined steadily since 2009 - combined operating income for FY2012 was YEN 67.6 billion (US$ 700 million)
    Operating income of Japan’s top 9 games companies declined steadily since 2009 – combined operating income for FY2012 was YEN 67.6 billion (US$ 700 million)
    In 2013, three newcomers (GREE, DeNA, GungHo) achieved higher operating income than all nine established Japanese game makers. Combined operating income for FY2012 was YEN 174 billion (US$ 1.8 billion) 
    In 2013, three newcomers (GREE, DeNA, GungHo) achieved higher operating income than all nine established Japanese game makers. Combined operating income for FY2012 was YEN 174 billion (US$ 1.8 billion) 

    The incumbents: Nintendo, Sony, Sega-Sammy, Bandai-Namco, Konami, Takara-Tomy, Square-Enix, Capcom, Tecmo-Koei

    Because of its size, Nintendo has the greatest weight in the overall performance of Japan’s traditional game sector. Nintendo has been dramatically affected by the shift from traditional game consoles to smartphones. Still, Nintendo (as all other Japanese iconic game companies) has tremendous resources, tremendous creativity, globally loved characters and brands, and huge cash reserves. I don’t think that Nintendo (and other Japanese game companies) risk as much to follow Nokia and RIM/BlackBerry’s fate, but may be more resilient. However, there has been substantial consolidation in Japan’s games sector of recent years, and the current challenges could lead to more M&A in Japan’s games sector.

    The disruptors

    We have only picked three important new market entrants – there are many more in Japan’s vibrant mobile game venture scene.

    DeNA

    DeNA initially started as a mobile auction group, and sees continuous strong growth and high margins.

    GREE

    Of these three, GREE is currently suffering some set-backs originating from GREE’s business model. GREE started as a SNS and social game platform on Japan’s “galake” (Galapagos Keitai) relying on Japan’s mobile internet services i-Mode, EZweb and Yahoo-Mobile, where operators traditionally take 9% commissions. Initially GREE tried to transfer this “platform on platform” business model to other countries, but this does not seem to work out. So GREE is now pivoting to original games, and has seen setbacks.

    GungHo

    GungHo started as a joint-venture with a US company, the purpose of this JV was Japan market entry for this US company. GungHo then pivoted away from this joint-venture to become a games company, and produced a series of games, which all did well, but not extraordinarily well. That is, until GungHo created “Puzzle and Dragons”, which is growing spectacularly well: Jan-June 2013 operating profits increased 4050.1% (four thousand fifty percent) compared to the same period one year ago, and net profits increased 2507.8% (two thousand seven percent) compared to Jan-June one year ago.

    The disruption

    The shift to smartphones is hitting Japanese traditional iconic game makers from all sides:

    • the shift from TV to tablets and mobile phones
    • the shift from dedicated game consoles to smart phones and tablets
    • the shift from Japan’s “galake” feature phones to smart phones
    • the shift in business model from traditional US$ 40-60 game cassettes-type to free game downloads with in-game purchases and advertising
    • …and more

    Japan’s game sector report

    Learn more: read our report on Japan’s game makers and markets
    (approx. 400 pages, pdf file)

    Copyright (c) 2013 Eurotechnology Japan KK All Rights Reserved

  • Japan’s electronics giants – FY2012 results announced. 17 years of no growth and no profits.

    Japan’s electronics giants – FY2012 results announced. 17 years of no growth and no profits.

    Japan’s electronics giants: as large as the economy of Holland, but 17 years of stagnation. No growth & no profits.

    Daniel Loeb: SONY’s uninvited guest gives Japan’s business culture a jolt

    Japan’s electronics giants combined are as large as the economy of Holland, but did not grow for about 17 years, and on average lost money all these years: no growth – no profits.

    SONY abruptly created global headlines (e.g see New York Times), because US activist investor Daniel Loeb publicly encourages SONY’s CEO to speed up change. Mr Loeb’s Third Point LLC fund is SONY’s biggest shareholder at this time – surprising many, maybe even surprising SONY’s CEO, Mr Hirai. Mr Loeb’s encouragement was well timed: Mr Hirai’s will present SONY’s new strategy on May 22.

    As we analyzed in our newsletter a few days ago and in more detail in our Electronic Industry Report, which was picked up by EE-Times and by the BBC, SONY recently earns its income, and offsets losses from the electronics and mobile phone businesses, mainly from asset sales and from subsidiary SONY-Finance – which sells life-insurance and credit cards. Therefore many believe that iconic SONY is undervalued, and needs much deeper and more fundamental change.

    Japan’s iconic Big-8 electronics giants posses amazing technologies and engineers. However, their current situation is very much less than amazing, indicating huge opportunities. A few days ago the Big-8 all announced their results for FY2012, which ended on March 31, 2013 – lets look at the results together here.

    long slow path to recovery for Japan's "Big-8" electronics giants
    long slow path to recovery for Japan’s “Big-8” electronics giants

    Japan’s electronics giants: Averaged over the last 15 years, Japan’s Big-8 created net losses of YEN 104 billion/year

    Subtracting losses from profits, and averaged over the last 15 years, Japan’s Big-8 created net losses of YEN 104 billion/year (US$ 1 Billion losses/year)

    For the last two financial years the Big-8 created net losses as follows:

    Financial Year ended combined net losses
    FY2012 March 31, 2013 YEN 1143 Billion (US$ 11 Billion)
    FY2011 March 31, 2012 YEN 909 Billion (US$ 8.9 Billion)

    Hitachi’s smart transformation

    Hitachi’s smart transformation (find an overview in our report) indicates that change can bring rapid improvement.

    Japan's "Big-8" electronics makers combined are about the size of Holland's economy - with one difference: Holland's economy grows, but Japan's electrical giants shrink and lose money at the same time
    Japan’s “Big-8” electronics makers combined are about the size of Holland’s economy – with one difference: Holland’s economy grows, but Japan’s electrical giants shrink and lose money at the same time

    No growth

    No growth: combined revenues of the Big-8 fell by YEN 1510 Billion (US$ 15 Billion) in the 15 years between FY1997 and FY2012 (assuming constant value YEN)

    Many expect that “smart transformation” and globalization, and opening-up to the global society – combined maybe with a rejuvenation of “the Japanese model”, can release the potential for growth, which has been held back for 15 years.

    In our electronic industry report we compare the Big-8 electronics companies with the Big-7 electronic parts manufacturers and show that their situation is much better, however the parts manufacturers face decreasing margins, also indicating the need for changing the business models and/or operations.

    Japan's "Big-8" may be seen as undervalued
    Japan’s “Big-8” may be seen as undervalued

    Japan’s Big-8 electronics makers combined have far lower market capitalization than Apple, Microsoft, Google or Samsung

    We produced the figure above for the presentation at the Foreign Correspondents Club in Tokyo about the “Apple-Samsung Patent War and Impact on Japans Industries”. We used the figure above to visualize the might of the Apple and Google/Samsung camps vs Japan’s Big-8 today. 15 years ago, the power of Apple vs Samsung vs Japan’s Big-8 was exactly opposite.

    There is no reason why Japan’s electronics sector cannot regain global strength and value – IF absolutely necessary changes are made. This situation represents outstanding opportunities, which no doubt are attracting Mr Loeb and his Third Point fund, and others.

    Understand Japan’s electronics sector: top 8 giants, and top electronic component makers

    Study our report “Japan electronics industries: mono zukuri” (approx. 230 pages, pdf file)

    Copyright (c) 2013 Eurotechnology Japan KK All Rights Reserved

  • SONY results for FY2012 (ended March 31, 2013)

    SONY results for FY2012 (ended March 31, 2013)

    SONY’s first profits in 4 years come from selling assets and buildings

    SONY results for FY2012- BBC interview

    SONY announced annual financial results today, and BBC interviewed me twice to comment on the results (read comments here on the BBC website).

    After 4 years of net losses, it is comforting to see SONY report profits again. However, lets look in detail where the profits come from.

    SONY reports YEN 230.1 Billion (US$ 2.4 Billion) in operating profits, and YEN 43.0 Billion (US$ 0.46 Billion) in net profits.

    SONY FY2012 Profits come from revaluing or selling assets and buildings

    Where do these profits come from? SONY sold the US headquarters building, sold a HQ building in Tokyo-Osaki, sold a chemicals division, and sold the investment in the mobile social games company DeNA, sold part of the investment in the (fascinating) cloud-based medical IT company M3 and restated the value of the remaining investment. All these transactions resulted in combined operating profits of US$ 2.6 Billion = almost equal to the reported operating profits. So it seems to me that the return to profits was achieved by asset sales and revaluations – not by selling revolutionary new products.
    Read below for more details.

    What are the reasons for SONY’s problems?

    In a nutshell, value moved from hardware manufacturing to software and platforms. SONY was in theory well positioned about 10 years ago to create a SONY platform, such as APPLE has created. However, SONY (a) missed that boat and (b) SONY-DNA and Japanese Government policy were and partly still are focused on “mono zukuri” – hardware manufacturing, which in itself is a good thing – as long there is even more passion for software and software platforms, and as long as market share guarantees pricing power and economy of scale as for Samsung.

    SONY: profits from life-insurance sales, real estate and asset sales dominated in FY2012
    SONY: profits from life-insurance sales, real estate and asset sales dominated in FY2012

    SONY’s profits come mainly from SONY-Finance (selling life insurance and credit card services), from asset sales and revaluations of investment holdings

    The figure above shows operating profits/loss for SONY’s different divisions. Not that SONY changed the way its divided up into divisions in FY2012.

    We can see above that for FY2012 (ending March 31, 2013), the biggest part of profits comes from the real estate and share holding sales. Regular business profits are mainly from SONY-Finance, which is a domestic Japanese company selling life-insurances, credit card services and online banking. The mobile phone division and the home electronics and TV division are heavily in the red, and shockingly the game division is essentially a non-profit business (the games division profits are the thin line between “Devices” and “other” in the Figure above) – while at the same time there is a global boom in mobile (smartphone) games. Its equally depressing, that SONY’s smartphone division is also recording massive losses.

    To add insult to injury, a recent study on how consumers value brands in Japan by NIKKEI ranked APPLE as No. 1 both for 2012 and 2013, while SONY was ranked No 20 in 2012, and No. 22 in 2013, two places below the mayonnaise brand “KEWPIE” in terms of brand power in the BtoC category for Japan.

    Looks like SONY has a tough road ahead…

    Read our report on Japan’s electronics industry sector:

    Copyright 2013 Eurotechnology Japan KK All Rights Reserved

  • Intellectual Japan – BBC: “Japan has to become a brain country” – from mono zukuri to brain country

    Intellectual Japan – BBC: “Japan has to become a brain country” – from mono zukuri to brain country

    Intellectual Japan: Japan’s electronics companies need new business models – interview for the BBC

    The BBC recently examined why Japan’s electronics sector has to create new business models, and quotes “Japan has to become a brain country”.

    Japan’s top 8 electronics companies combined are as large as the Netherlands economically, but have shown zero growth and zero income over the last 14 years – thus represent “sleeping giants” – or dinosaurs, depending on the point of view, and depending on whether these companies succeed to reinvent themselves.

    We have updated our report on “Japan’s electronic manufacturers: mono zukuri” to analyze Japan’s electronics manufacturing sector, and to explain who the winners and who the losers are. Read a short summary in this newsletter below.

    apan's electronics companies combined are as large as Holland economically
    apan’s electronics companies combined are as large as Holland economically

    Japan’s top electronics companies combined are as large as the Netherlands economically, but have not shown any revenue growth over the last 14 years

    Japan’s electronics sector still today is largely guided by national industrial policy, and by the management principles created long ago by charismatic founders such as Matsushita and Ibuka.

    Intellectual Japan: smart transformation at Hitachi led by the CEO and by the Chief Transformation Officer CTrO

    Hitachi’s “Chief Transformation Officer” (“CTrO”) at a recent presentation, explained that until 2 years ago Hitachi benchmarked its financial data purely domestically – until 2 years ago, Hitachi only compared performance with competitors such as Panasonic and Toshiba.

    Only 2 years ago, Hitachi started to benchmark performance with global competitors such as GE and Siemens.

    Read a summary of Hitachi’s “Smart Transformation project” in our electronics industry report.

    Japan's top 8 electronics companies combined lose YEN 50 billion/year since 1998
    Japan’s top 8 electronics companies combined lose YEN 50 billion/year since 1998

    Japan’s top 8 electronics companies lost an average of YEN 50 billion/year over the last 14 years

    Intellectual Japan: electronic component makers

    Japan’s electronics component makers, such as Kyocera or Murata, which is on the official supplier list of Apple, report positive income – although margins are declining and the component industry sector is much smaller than the top 8 electronics manufacturers.

    Drastic transformation is necessary to revive Japan’s electronics industry sector. Drastic change will happen one way or another and represents important opportunities. More details in our electronics industry report

    Japan electronics industries – mono zukuri.

    Copyright 2013 Eurotechnology Japan KK All Rights Reserved

  • SONY profits: 56% of profits are from selling life insurance and financial products (manuscript invited by BBC)

    SONY profits: 56% of profits are from selling life insurance and financial products (manuscript invited by BBC)

    Games are 11% of SONY’s sales

    SONY profits: Currently 56% of SONY’s profits come from selling life insurance and financial products

    Games are 11% of SONY‘s sales – and currently 56% of SONY profits come from selling life insurance, consumer loans and financial products in Japan. Games are important, but are not going to make or break SONY at this time.

    Technical specs of the next Playstation need to be fantastic. Specs alone however have not been the main focus for quite some time now. Smart phones, social games, smooth linking of all “screens” are disrupting the games sector. In Japan, the social games market is already twice the value of the traditional game console market (excluding software): in anticipation of their global success, GREE and DeNA combined have climbed to half the market cap of all of SONY.

    SONY’s game business model also faces disruption by free and $.99 “snack-type” games, downloaded to mobile phones and tablets – to win in this sector SONY would have to beat Rovio’s Angry Birds brand and their galactic and Starwars games among others. Its hard for SONY to please both hardcore gamers, and the much larger audience of casual gamers looking for quick in-between low cost or free game “snacks”.

    If I was CEO of SONY, another fact I would worry about is that there are currently about 800 games on Playstation, while here are about 130,000 games on iOS, and more than 100 new games submitted to Apple everyday. Now if Apple would take this enormous developer support to a next generation Apple-TV ecosystem, I would have sleepless nights about my whole game business division if I was SONY-CEO.

    I like SONY’s acquisition of the cloud game platform Gaikai

    Personally, I like SONY’s acquisition of the cloud game platform Gaikai. It will be key for SONY to keep a great team at Gaikai. Ultimately Gaikai might become SONY’s most important game platform. Improving the specs of SONY’s Playstations is necessary for SONY to remain a console player – however for business success SONY needs to drive disruption instead of reacting to others like Apple or Rovio. Gaikai could give SONY that chance. SONY’s own studios could also be a more important weapon in the game.

    SONY is often taken as a poster child for Japan’s stagnation

    over the last 15 years, SONY showed essentially no revenue growth and close to zero average profits and margin. However, CANON proves that even a Japanese electronics company can deliver consistent growth and good margins, but copying CANON of course is not the way to go. SONY will need to create its own way.

    Read our report on Japan’s electronics industry sector:

  • Japanese electronics groups need new business models (BBC-interview: Yen ‘not the cause of woes of Japan’s electronics firms’)

    Japanese electronics groups need new business models (BBC-interview: Yen ‘not the cause of woes of Japan’s electronics firms’)

    Japanese electronics groups combined as of similar size as the economy of the Netherlands

    Over the last 15 years combined annual sales growth was zero, and combined annual loss was US$ 0.6 billion/year

    Japan’s “Big-8” electrical groups (Hitachi, Panasonic, Sony, Mitsubishi-Electric, Sharp, Toshiba, Fujitsu, NEC) combined are of similar economic size as the Netherlands.

    Over the last 15 years, their combined annual sales growth was zero, and their combined annual loss was YEN 50.6 billion/year (= US$ 0.6 billion/year).

    Compelling evidence that new business models for Japan’s electronics sector present a huge opportunity – as explained in this BBC interview.

    Sales growth of Japan's "Big-8" electrical manufacturers vs top 7 electronics component makers
    Sales growth of Japan’s “Big-8” electrical manufacturers vs top 7 electronics component makers

    Contrasting Japan’s “Big-8” electronics groups (Hitachi, Panasonic, Sony, Mitsubishi-Electric, Sharp, Toshiba, Fujitsu, NEC) with Japan’s 7 electronic parts makers (Murata, Kyocera, TDK, Alps, Nidec, Nitto, ROHM)

    Over the last 14 years since FY1997, the combined growth in revenues (=sales) of Japan’s “Big-8” electronics groups was zero.
    The compound annual growth rate (CAGR) of Japan’s top 7 electronic parts makers combined was +3.1%.

    Net income/losses of Japan's "Big-8" electronics giants vs top-7 electronics components makers
    Net income/losses of Japan’s “Big-8” electronics giants vs top-7 electronics components makers

    Net income (profit) of Japan’s “Big-8” electronics groups vs top-7 electronics parts makers

    Over the last 14 years since FY1997, Japan’s “Big-8” electronics groups combined showed average losses of YEN 50.6 billion/year (=US$ 0.6 billion/year), while Japan’s top 7 electronic parts makers combined earned YEN 196 billion/year (= US$ 2.4 billion/year).

    Net income/losses of Japan's top electrical groups
    Net income/losses of Japan’s top electrical groups

    Net after tax income of Japan’s “Big-8” electronics groups

    This figure shows net after tax income for Japan’s “Big-8” electronics groups (Hitachi, Panasonic, Sony, Mitsubishi-Electric, Sharp, Toshiba, Fujitsu, NEC), for the years since FY1997. For 5 of these 14 years the industry sector reported combined losses, which in total exceeded the profits achieved in good years.
    As a result, averaged over all 14 years, the industry sector shows combined losses on the order of US$ 0.6 billion/year.

    Creating new business models for this very large industry sector (of similar economic size as the Netherlands) is a huge opportunity.

    et income/losses of Japan's top-7 electronic component makers
    et income/losses of Japan’s top-7 electronic component makers

    Net income of Japan’s top 7 electronic parts makers

    Japan’s top 7 electronic parts makers are in a much better financial situation than Japan’s electrical groups.

    Over the last 14 years since FY1997, this industry sector only showed a net overall loss one single time – in the year following the Lehman shock, but showed combined net profits during all other years, resulting in average annual net profits on the order of US$ 2.4 billion/year.

    BBC interview: "New business models for Japan's electrical groups needed"
    BBC interview: “New business models for Japan’s electrical groups needed”

    BBC interview:
    Watch an extract of the BBC interview about Japan’s electrical industry sector here: Yen ‘not the cause of woes of Japan’s electronics firms’.

    More detailed data and analysis in our report on Japan’s electronics industry sector.

    Japan electronics industries – mono zukuri

    Copyright 2013 Eurotechnology Japan KK All Rights Reserved

  • SONY revival prospects and shareholder meeting (BBC interview)

    SONY revival prospects and shareholder meeting (BBC interview)

    SONY needs to leave 1990 structures behind and more more than commodities

    SONY revival from record YEN 455 billion loss for FY2010

    SONY (6758) announced a record YEN 455 Billion (US$ 5.7 Billion) loss for financial year 2011, which ended March 31, 2012, and held the annual shareholder meeting on Wednesday.

    Gerhard Fasol on BBC TV about "Sony executives face weary shareholders at AGM"
    Gerhard Fasol on BBC TV about “Sony executives face weary shareholders at AGM”

    SONY revival: My points in the BBC interview are

    1. Stuck with 1990’s structures: SONY’s case is representative for many Japanese companies and also for many aspects of Japan as a whole today: SONY grew very rapidly until around 1995, when growth stopped. Since around 1995, there is no growth and averaged over the years zero profit. It’s very clear, that many of the management structures and ways of doing things during the pre-1995 rapid growth phase don’t work at all any more today.
    2. A commodity maker? SONY needs to decide either to build an attractive ecosystem including attractive high-margin products – such as Apple does – or if SONY continues to shoot for the commodity business, with low margins, then it needs to be No. 1 in that space.
    3. No diversity? in 2012? When we look at SONY’s website describing SONY’s top management, we can see that SONY’s top managers are almost all Japanese men – almost no diversity. SONY’s overwhelmingly Japanese male managers know Japan best – so it’s no surprise that SONY’s best performing division is the Financial Services division: a mainly domestic Japanese consumer credit card and life insurance company.
    SONY's sales stopped growing in 1998 ...
    SONY’s sales stopped growing in 1998 …
    .. while net margin and net profits have been around zero
    .. while net margin and net profits have been around zero

    Read our report on Japan’s electronics industry sector:

    Copyright 1997-2013 Eurotechnology Japan KK All Rights Reserved

  • Future of Video Game Sector (CNBC Airtime: Thurs. Jul. 30 2009)

    Future of Video Game Sector (CNBC Airtime: Thurs. Jul. 30 2009)

    Read more about Nintendo and the games sector: http://www.eurotechnology.com/store/jgames/

    Read more about Japan’s electrical industry sector in our Japan’s electronics industry report (pdf file)

    Subscribe to our newsletters:
    technology newsletters from Japan

  • Japan’s games sector overtakes electrical sector in income

    Japan’s games sector overtakes electrical sector in income

    Japan’s games sector is booming – and net annual income of Japan’s top 9 game companies combined has now overtaken the combined net income of all Japan’s top 19 electronics giants (including Hitachi, Panasonic, SONY, Fujitsu, Toshiba, SHARP… at the top, and ROHM, Omron… further down the ranking list).

    Why does it make sense to compare electronics giants with game companies? In many areas, especially home electronics and personal portable devices these two sectors compete for exactly the same consumer spending budgets and mind share.

    Pressure on Japan’s electrical giants for much more fundamental restructuring is increasing. More details below and find our calculations and analysis explained in our reports: Report on Japan’s electrical industry sector and our Report on Japan’s game industries.

    Figure compares the added total net income of Japan’s top 18 electrical companies (Hitachi, Panasonic, SONY…) with the combined total net income of Japan’s top 9 games companies (Nintendo, Bandai Namco…, not including SONY Computer Entertainment, because net income is not available).

    The games sector – lead by Nintendo – shows stable net income all through the current crisis years. While pressure on the electrical giants for more fundamental restructuring is increasing.

    -Money as a percentage of total money in Japan
    -Money as a percentage of total money in Japan

    Combined total net annual income of Japan’s games sector. (SONY Computer Entertainment is not included, since net income is not available)

    Combined annual income of Japan's top game companies
    Combined annual income of Japan’s top game companies

    Detailed analysis in our report on Japan’s games sector.

    Copyright (c) 2013 Eurotechnology Japan KK All Rights Reserved

  • Japan electronics groups: global benchmarking

    Japan electronics groups: global benchmarking

    Japan electronics groups have far lower income/profits than EU or US comparable corporations

    Ripe for drastic reform and transformation: 18 years no growth and almost no profits

    Lets look at global benchmarking of Japan’s top electrical groups Panasonic and Hitachi (representative of Japan’s top ten electrical giants) – in our previous blog we suggested that full recovery to 2008 (FY2007) levels may take until 2016 – about seven years in terms of income, and about 3-4 years in terms of revenues – UNLESS major restructuring happens. Will it be done?

    We also take a look at specialist ROHM, which used to have outstanding margins because of the focus on highly specialized electrical and electronic components. ROHM’s shareholder proposals recently made headlines.

    Comparing Japan’s top electrical groups Panasonic and Hitachi with GE and SIEMENS clearly shows the different philosophies in US, EU and Japan:

    US based GE aims for 15% net margin.

    Germany based Siemens and Japanese giants Panasonic and Hitachi in the 1990s all had net margins close to zero. However, while Panasonic and Hitachi maintained their margins close to zero since the 1990s, Siemens clearly aims for US level margins – and achieved a slow and steady upward trend.

    Very dramatic restructuring would be necessary to bring Japan’s electric giants onto such a path. I think it is quite obvious exactly which restructuring is necessary. I also believe that if carried out it will actually create more employment in Japan than maintaining the existing structure of Japan’s electrical industry sector. However, actually carrying such restructuring will require superhuman effort… will this happen?

    Resistor maker ROHM

    Rohm is another interesting story – and a fascinating Kyoto-culture company (with headquarters not so far from superstar Nintendo). Rohm was founded in 1958 by today’s CEO Sato Kenichiro to make resistors, and he later changed the name to R.ohm and then ROHM – today 80% of products are semiconductors. With increasing competition ROHM’s initially very high margins melted away. To counter the trend towards commoditization, ROHM invests heavily in R&D with technology centers around the world. Last week ROHM made global headlines: US fund Brandes had proposed a US$ 157 million share buy back, which was rejected at the shareholder meeting. Looking at ROHM’s margin over the years, its clear that action is required to bring margins again from today’s zero to the previous 20% level. I can sympathize with shareholders who think that a Shuji Nakamura / Nichia-type R&D breakthrough would be more likely to deliver such a comeback rather than a share buy back.

    Note that not all shareholder proposals by US or European funds are rejected summarily at Japanese company shareholder meetings… some well prepared proposals have actually been accepted successfully.

    Margins of Panasonic, Hitachi, Rohm with Siemens and GE
    Margins of Panasonic, Hitachi, Rohm with Siemens and GE

    Starting from similar positions in the 1990s:

    GE, Siemens, Hitachi and Panasonic all four had almost the same size in terms of annual sales back in the 1990s – today GE is twice the size of Hitachi or Siemens and 2.5 the size of Panasonic

    Today, GE is about twice the size as Hitachi or Siemens, and about 2.5 the size of Panasonic. It seems that successful globalization is a necessary factor to achieve GE-style growth – necessary, but not sufficient… (see: our analysis of dramatic differences in globalization of Japan’s electric groups). The current crisis is a big opportunity for further growth by strong companies.

    Revenue growth of Hitachi and Panasonic compared with SIEMENS and GE
    Revenue growth of Hitachi and Panasonic compared with SIEMENS and GE

    Japan electronics industries – mono zukuri

    Copyright 2013 Eurotechnology Japan KK All Rights Reserved

  • Japan’s electronics companies & the crisis

    Japan’s electronics companies & the crisis

    Japan’s top 20 electronics companies combined are about as large as The Netherlands economically, and have big impact on the world economy. Our analysis shows how dramatically Japan’s electronics companies have been hit by the current crisis (except for Nintendo). We suggest that full recovery to 2008 (FY2007) levels may take until 2016 – about seven years in terms of income, and about 3-4 years in terms of revenues.

    The crisis has thrown Japan’s electrical companies back to 2002 in terms of combined annual net incomes. It has taken Japanese electricals 7 years to climb from the 2002 crisis to the 2008 (FY2007) boom. Since Japan’s electrical companies have made relatively soft adjustments, but not a full fundamental industry restructuring yet, we think that it is likely that developments will proceed along a similar path as in the past: following such an analysis we think that it will take about 7 years from 2009 (ie. until 2016) for Japan’s electrical companies to work their way back up to 2008 net income levels. (Find detailed financial data and analysis in our report on Japan’s electronics industries)

    net income of Japan's electronics companies
    net income of Japan’s electronics companies

    Back to FY2003:

    Combined annual sales for the financial year ending March 31, 2010, are at a similar level as in FY 2003, ie Japan’s electrical industry has been taken back 6 years in terms of revenue growth. Again, since a dramatic and fundamental industry restructuring has not yet taken place, we believe that we can expect it will take about 4 years for Japan’s electronics industry to grow again to 2008 (FY2007) size in terms of annual revenues.

    net revenues of Japan's electronics companies
    net revenues of Japan’s electronics companies

    The crisis spreads the field…

    During the “good” years of FY1997 – FY2007 the differences between top and bottom performing electrical companies became steadily smaller: the field narrowed.

    This figure shows that during the current crisis the spread between best and worst performing companies became more than twice as wide. The crisis clearly differentiates winners (Nintendo) from losers in terms of operating margins.

    operating margins of Japan's electronics companies
    operating margins of Japan’s electronics companies

    Read more details in our report about Japan’s electrical industries:

    Japan electronics industries – mono zukuri

    Copyright 2013 Eurotechnology Japan KK All Rights Reserved

  • More Drastic Changes Needed at Sony (CNBC TV interview)

    More Drastic Changes Needed at Sony (CNBC TV interview)

    SONY needs drastic changes: from commodities to networks and communities

    More Drastic Changes Needed at Sony (CNBC Airtime: Thursday, May 14, 2009)

    Read more about SONY and Japan’s electrical industry sector

    Copyright (c) 2013 Eurotechnology Japan KK All Rights Reserved

  • Foggy Outlook for Global Tech Sector (CNBC TV interview)

    Foggy Outlook for Global Tech Sector (CNBC TV interview)

    Foggy Outlook for Global Tech Sector (Airtime: Tues. Feb. 10 2009)

    Copyright (c) 2013 Eurotechnology Japan KK All Rights Reserved

  • Wild differences in operating margins for mobile, TV media groups and electricals

    Wild differences in operating margins for mobile, TV media groups and electricals

    We analyze the effect of the crisis on operating margins in three different sectors in Japan:

    (1) electronics,
    (2) mobile communications
    (3) TV media groups.

    In sector (1), Nintendo‘s margins are above 30% and increasing despite the crisis, while traditional electronics companies’ margins are evaporating.

    (2) for mobile operators DoCoMo, KDDI and SoftBank margins are 10%-20% and increasing despite the crisis! Could mobile phone usage be crisis resistant?

    (3) TV media groups had healthy margins in the 10%-20% range back around 2001- however these margins have been slowly melting away, and TV group margins are heading to cross the zero line into the red zone by 2010-2011. Watch out for a TV media crisis. Read more below.

    Consumer electronics sector operating margins:

    Nintendo bucks the trend: while Japan’s electronics firms’ margins are dropping into the red, and have never been much higher than 5% during the last 10 years, Nintendo‘s operating margins are above 30% and rising despite the crisis.

    Margins of top Japan's electronics multinationals and Nintendo
    Margins of top Japan’s electronics multinationals and Nintendo


    (Find full data, fully labeled graphics and analysis in our report on Japan’s electrical companies)

    Mobile phone sector margins are 10% – 20% and rising despite the crisis.

    Mobile phones seem to be resistant to the current crisis. DoCoMo‘s, KDDI‘s and Softbank‘s margins are healthy and improving despite the crisis.

    Operating margins of Japan's top 3 mobile operators
    Operating margins of Japan’s top 3 mobile operators


    (Find full data, fully labeled graphics and analysis in our JCOMM Report)

    Margins of TV media groups have been melting away since their peak in 2001.

    Back in 2001 Japan’s TV media groups used to enjoy healthy margins of up to 20%. Over the last 8 years these healthy margins have molten away, and Japan’s large TV media groups are likely to all simultaneously go into the red from 2010 onwards, unless dramatic action is taken. Media groups will need to grow profitable new business, e.g. mobile-TV, and other cross-media growth areas.

    Could it be that recent anti-takeover measures have made the large TV media groups complacent?

    Operating margins of Japan's TV media groups
    Operating margins of Japan’s TV media groups


    (Find full data, fully labeled graphics and analysis in our J-MEDIA Report)

    Copyright (c) 2013 Eurotechnology Japan KK All Rights Reserved

  • Japan trends 2008/2009

    One of our clients in the financial industry asked me several trend questions:

    1. Q1: Biggest surprises in Japan in 2008?
      • Collapse of Japan’s mobile phone handset market (read our blog). In this context the Japanese telecom equipment makers association invited me to give a presentation, which was booked out 2-3 weeks ahead – about 100 Japanese telecom equipment maker managers attended! The General Affairs Vice-Minister / Secretary of State attended….
      • The dramatic increase of acquisitions by Japanese companies:
    2. Q2: Biggest changes for 2009?
      • Hopefully LED/Solid state lighting going mainstream to save energy
      • Batteries and solar cells in combination starting to replace petrol for cars
      • Solar cell battle (between Q-cells, SHARP and others)
    3. Q3: Key topics in Japanese media for 2009?
      • Financial crisis and reviving the economy
      • Crisis of the car industry – and car industry’s paradigm shift

    Copyright 2013 Eurotechnology Japan KK All Rights Reserved

  • Apple Nintendo Sony: The power of focus

    Apple Nintendo Sony: The power of focus

    Lets benchmark three iconic companies:

    Apple Nintendo Sony

    Apple Nintendo Sony: three iconic companies evolving along very different paths. Apple’s current physical products famously all fit onto a single mid-sized table. Nintendo’s current physical products as well, for SONY you’d need a warehouse.

    • APPLE: Wednesday October 22 APPLE announced spectacular full-year results with a year-on-year net income increase of 38%. The results are even better than they look, because iPhone sales and income are spread forward over 2 years due to accounting rules. (See our comments on CNBC here)
    • NINTENDO: on August 29, 2008 Nintendo revised the forecast for full-year net income upward by +26.2% (See our comments on CNBC here)
    • SONY: in contrast, on October 23, 2008, SONY said that full-year net income (for the financial year ending March 2009) is expected to be 37.5% lower than previously predicted (see our comments on SONY’s 1Q results here on CNBC)

    Apple Nintendo Sony – Lets look at today’s market caps:

    • APPLE market cap = US$ 85.6 Billion (about 4 x SONY)
    • NINTENDO market cap = US$ 37.2 Billion (about 2 x SONY)
    • SONY market cap = US$ 19.9 Billion

    Apple Nintendo Sony – Why this dramatic difference in market caps? We believe its focus.

    Apple and Nintendo are companies with clear focus. Lets look at the details below:

    Comparing revenues (sales):

    SONY = 3 x APPLE
    SONY = 4 x NINTENDO

    Annual revenues of Apple, Nintendo and SONY
    Annual revenues of Apple, Nintendo and SONY

    Comparing annual operating income:

    APPLE = 3 x SONY
    NINTENDO = 3 x SONY

    Operating income of Apple, Nintendo and SONY
    Operating income of Apple, Nintendo and SONY

    Comparing operating margin:

    APPLE = 9 x SONY
    NINTENDO = 15 x SONY

    Operating margin (operating income as a ratio of revenues) for Apple, Nintendo and SONY
    Operating margin (operating income as a ratio of revenues) for Apple, Nintendo and SONY

    Read our report on Japan’s electronics industry sector

    Japan electronics industries – mono zukuri

    Copyright (c) 2008-2013 Eurotechnology Japan KK All Rights Reserved

  • XBOX Japan entry

    XBOX Japan entry

    XBOX still faces difficulties in Japan

    XBOX Japan entry: Microsoft reduces prices by 30%

    Microsoft announced to reduce prices for Xbox-360 by 30% in Japan. We believe that this price reduction will not be enough to bring the breakthrough for Xbox in Japan.

    Nintendo has reinvented the game industry, created a completely new paradigm. Nintendo does not reduce prices. Xbox is still in the pre-paradigm shift world… prices are not the issue.

    Japan game market report (398 pages, pdf-file):

    XBOX Japan entry: CNBC interview

    Copyright 2013 Eurotechnology Japan KK All Rights Reserved

  • XBOX Japan strategy – Microsoft still struggling

    XBOX Japan strategy – Microsoft still struggling

    Microsoft XBOX introduced XBOX to Japan on February 22, 2002

    XBOX Japan Strategy – CNBC interview

    Microsoft introduced the original XBOX game console in the USA on November 15, 2001, in Japan on February 22, 2002, and in Europe on March 14, 2002.

    During the period January-June 2005, three years after introduction of the XBOX to Japan’s market, SONY sold about 2.4 Million game terminals in Japan, Nintendo sold about 1.9 Million, and Microsoft about 9000 XBOXes, about 0.2% marketshare.

    As of August 24, 2008, Nintendo has sold about 6.7 Million Wii, SONY has sold about 2.3 PS3, and Microsoft about 380,000 XBOX-360 in Japan, a 4% share in this segment.

    A few days ago, Microsoft announced a price cut of 30% for XBOX-360 in Japan – the video below gives our comments on this price reduction on CNBC.

    Here is a short summary of the CNBC-TV interview:

    XBOX Japan Strategy Question: Do you think the price reduction is going to do the trick?

    A: No. In other markets maybe, but not in Japan.

    XBOX Japan Strategy Question: Do you think XBOX can be successful in Japan? What will it take before Microsoft will give up and say it just isn’t working

    A: Of course Microsoft can be successful in Japan with XBOX. There is no law that XBOX cannot be successful in Japan. Microsoft generally is a company that never gives up. But they have to change their strategy for Japan.

    XBOX Japan Strategy Question: So Microsoft isn’t doing the right things. What would the right things be?

    A: Difficult to say of course, if it was easy Microsoft would already have done this. The situation is that Nintendo has completely changed the business paradigm of the game industry. Microsoft’s XBOX is still operating under the old paradigm.

    XBOX Japan Strategy Question: How long do you think Nintendo’s sweetspot is going to last?

    A: Nintendo have reinvented the game industry, and completely changed the business models. They also make a lot of their own software. All this puts Nintendo into a very good position.

    What can we learn about strategy for Japan from Microsoft’s XBOX experience:

    Global products, not adapted to Japan’s market, often do not succeed in Japan. Microsoft’s XBOX is a very good example. Microsoft has one of Japan’s most famous brands, so its not a problem of the brand.

    Microsoft faces three problems in Japan:

    1. XBOX is not made for Japanese users in mind
    2. Nintendo changed the paradigm of the game industry, and XBOX is still on the old track
    3. Of three global game console companies (Nintendo, SONY, Nintendo) two are both much stronger than Microsoft in games, and both are on their hometurf in Japan. Microsoft would need to invest more and focus efforts much more on Japan to succeed in Japan with XBOX.

    Japan game market disruption market report:

    Japan game market report (398 pages, pdf-file):

    Copyright (c) 2013 Eurotechnology Japan KK All Rights Reserved

  • Sony Plans LCD TV Expansion

    Sony Plans LCD TV Expansion

    Read our report on Japan’s electronics industry sector:

    Copyright 2013 Eurotechnology Japan KK All Rights Reserved·

  • Sony Needs a Hit Product – TV interview

    Sony Needs a Hit Product – TV interview

    Read our report on Japan’s electronics industry sector:

    Copyright 2013 Eurotechnology Japan KK All Rights Reserved