Category: games

  • Pokemon Go – everybody loves Pikachu…

    Pokemon Go – everybody loves Pikachu…

    Pokemon Go is great – but will it bring another Nintendo boom as in 2009? or even exceed 2009?

    Google spin-out Niantic Labs’ augmented reality smartphone game booms to the top of charts

    Niantic Labs is specialized on augmented reality games. In a previous game, Ingress, players selected about 15 million memorable locations globally. Niantic picked about 5 million of these crowd source generated locations, placed characters out of 740 Pokémon characters at such Pokéstops. Using smartphones, GPS, cameras and their avatars, players hunt Pokémon characters placed at Pokéstops, bring them to arenas/gyms and let their Pokémon characters fight for arenas/gyms. Thats just the beginning, and we can imagine many ways to expand this basic game structure, for example Pokéstops and Gyms sponsored by stores or corporations.

    Overcoming Galapagos

    Pokémon Go’s success is also significant, because the fundamentally Japanese Nintendo and The Pokémon Company are overcoming the Japan-Only Galapagos Syndrome by cooperating with Google and San Francisco based Google spin-out Niantic.

    At the same time, Pokémon Go is also an indication of the power Nintendo can achieve in the smart phone sector. Will Nintendo dethrone current smart phone game kings Mixi and Gung-Ho in Japan?

    Everybody loves Pikachu… No. 25 of currently 740 Pokémon characters

    For the open day at my older son’s high school, kids made posters introducing their country: the highest mountain, the most characteristic flower, and the most famous person.

    One Japanese student writes: “The Prime Minister is the most famous person in Japan, because he decides everything”.

    Another Japanese student writes: “Pikachu is Japan’s most famous person, because everybody loves Pikachu”. Which of the two Japanese students knows more about his own country?

    Pikachu is No. 25 of currently 740 Pokémon characters, and represents electricity with his zig-zag lightening bolt tail, and bright yellow color.

    Pokémon character developer The Pokémon Company estimates the global market for Pokémon characters to be US$ 48 billion.

    Nintendo market cap increases from US$ 20.3 billion to US$ 31.5 billion from 6 to 13 July, 2016

    Nintendo shares rise from ¥14,055 in the morning of July 6, 2016 to ¥21,830 at close on July 13, 2016

    Nintendo market cap rises from ¥ 2.56 trillion (US$ 20.3 billion) in the morning of July 6, 2016 to ¥ 3.09 trillion (US$ 31.5 billion) at close on July 13, 2016

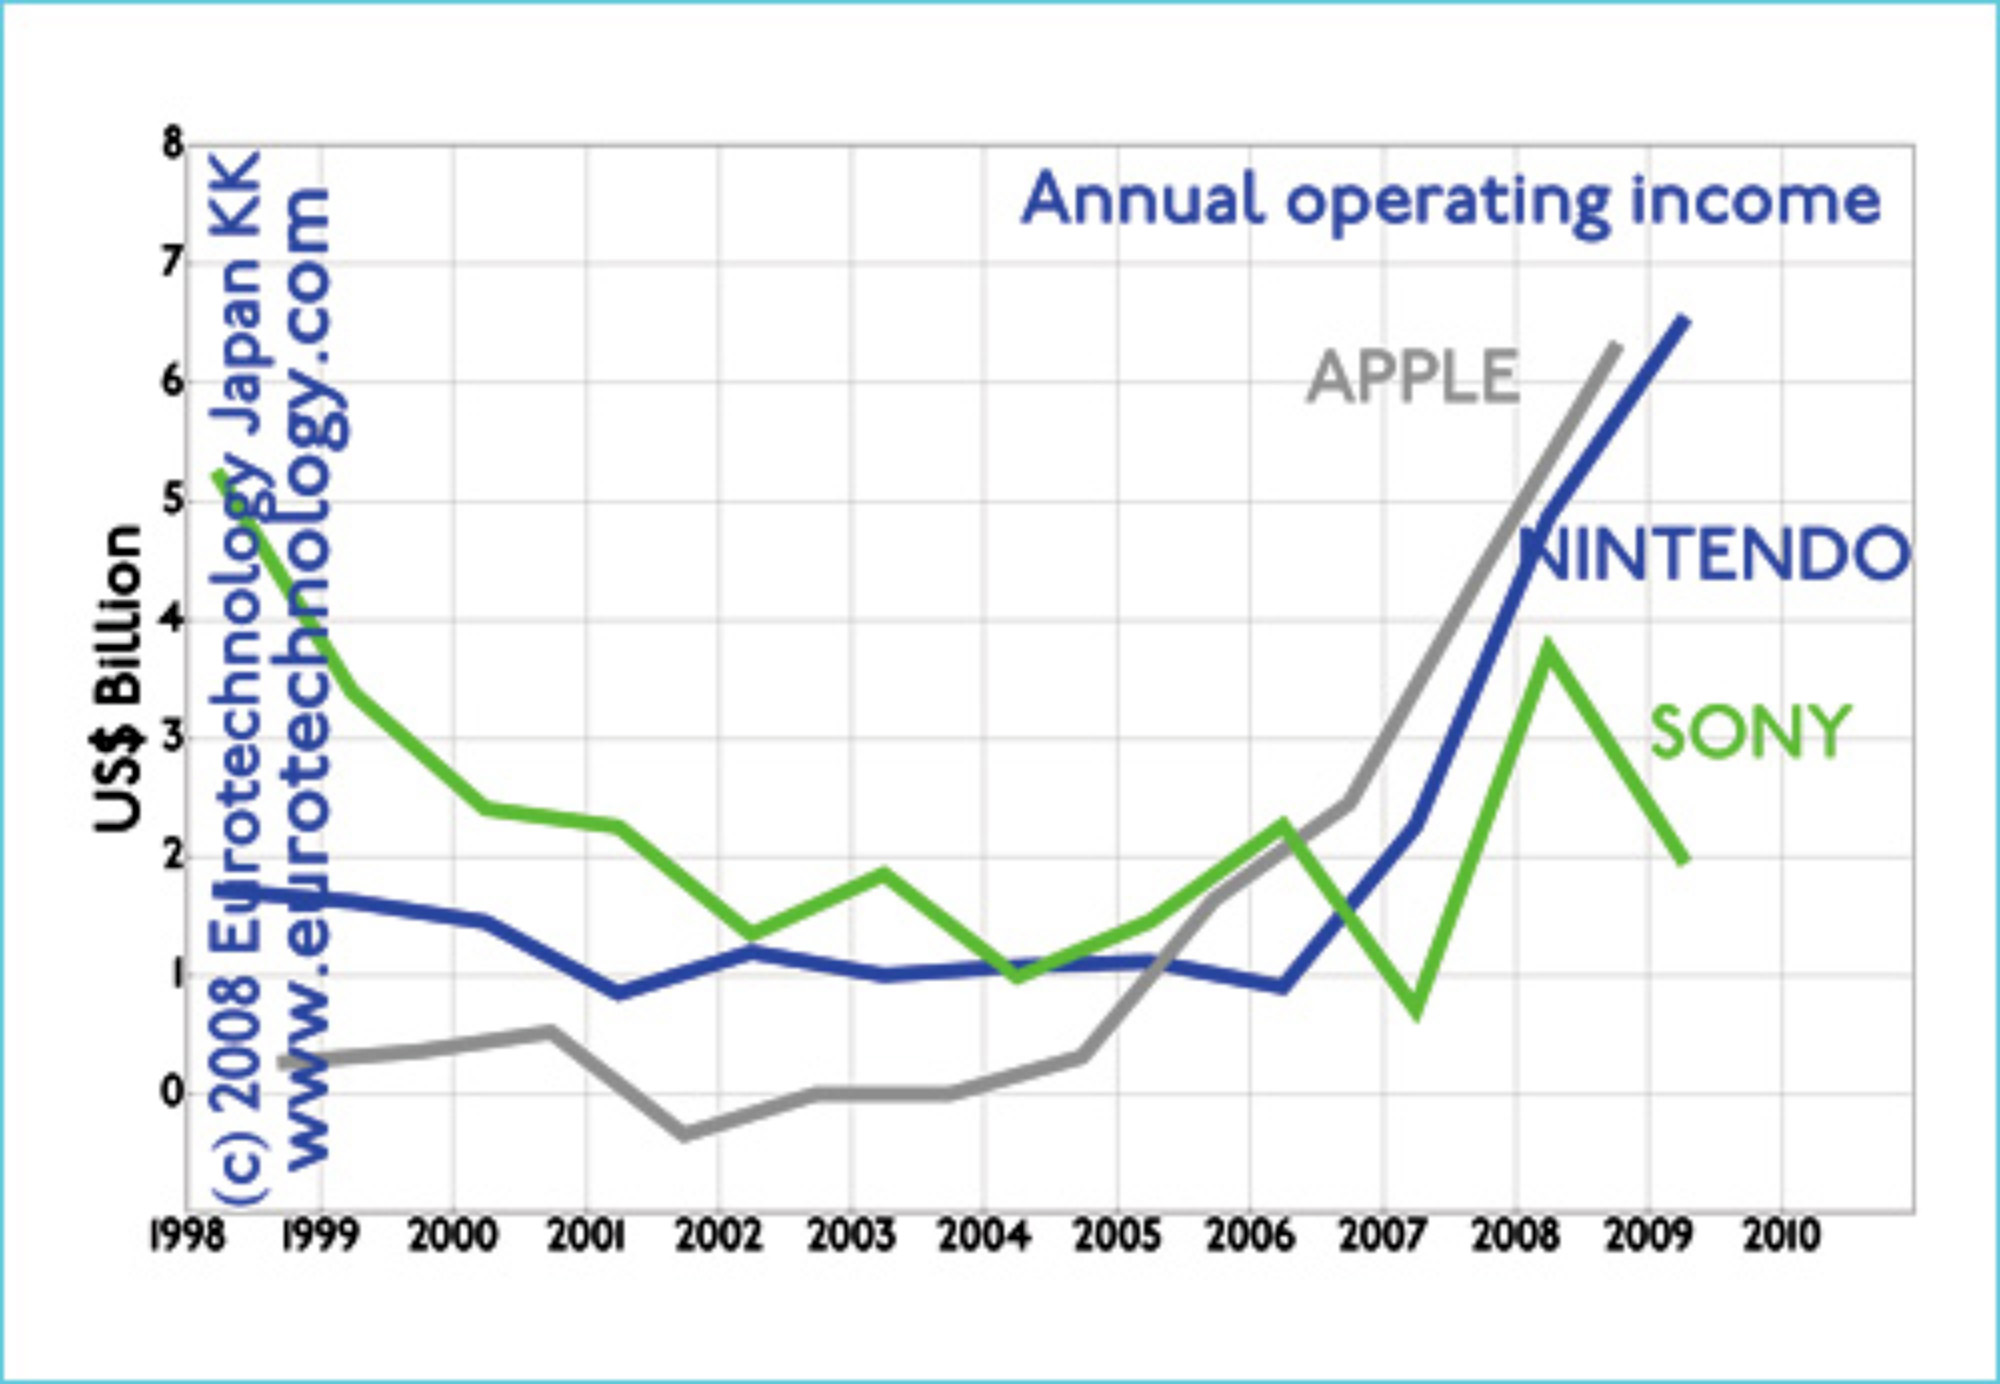
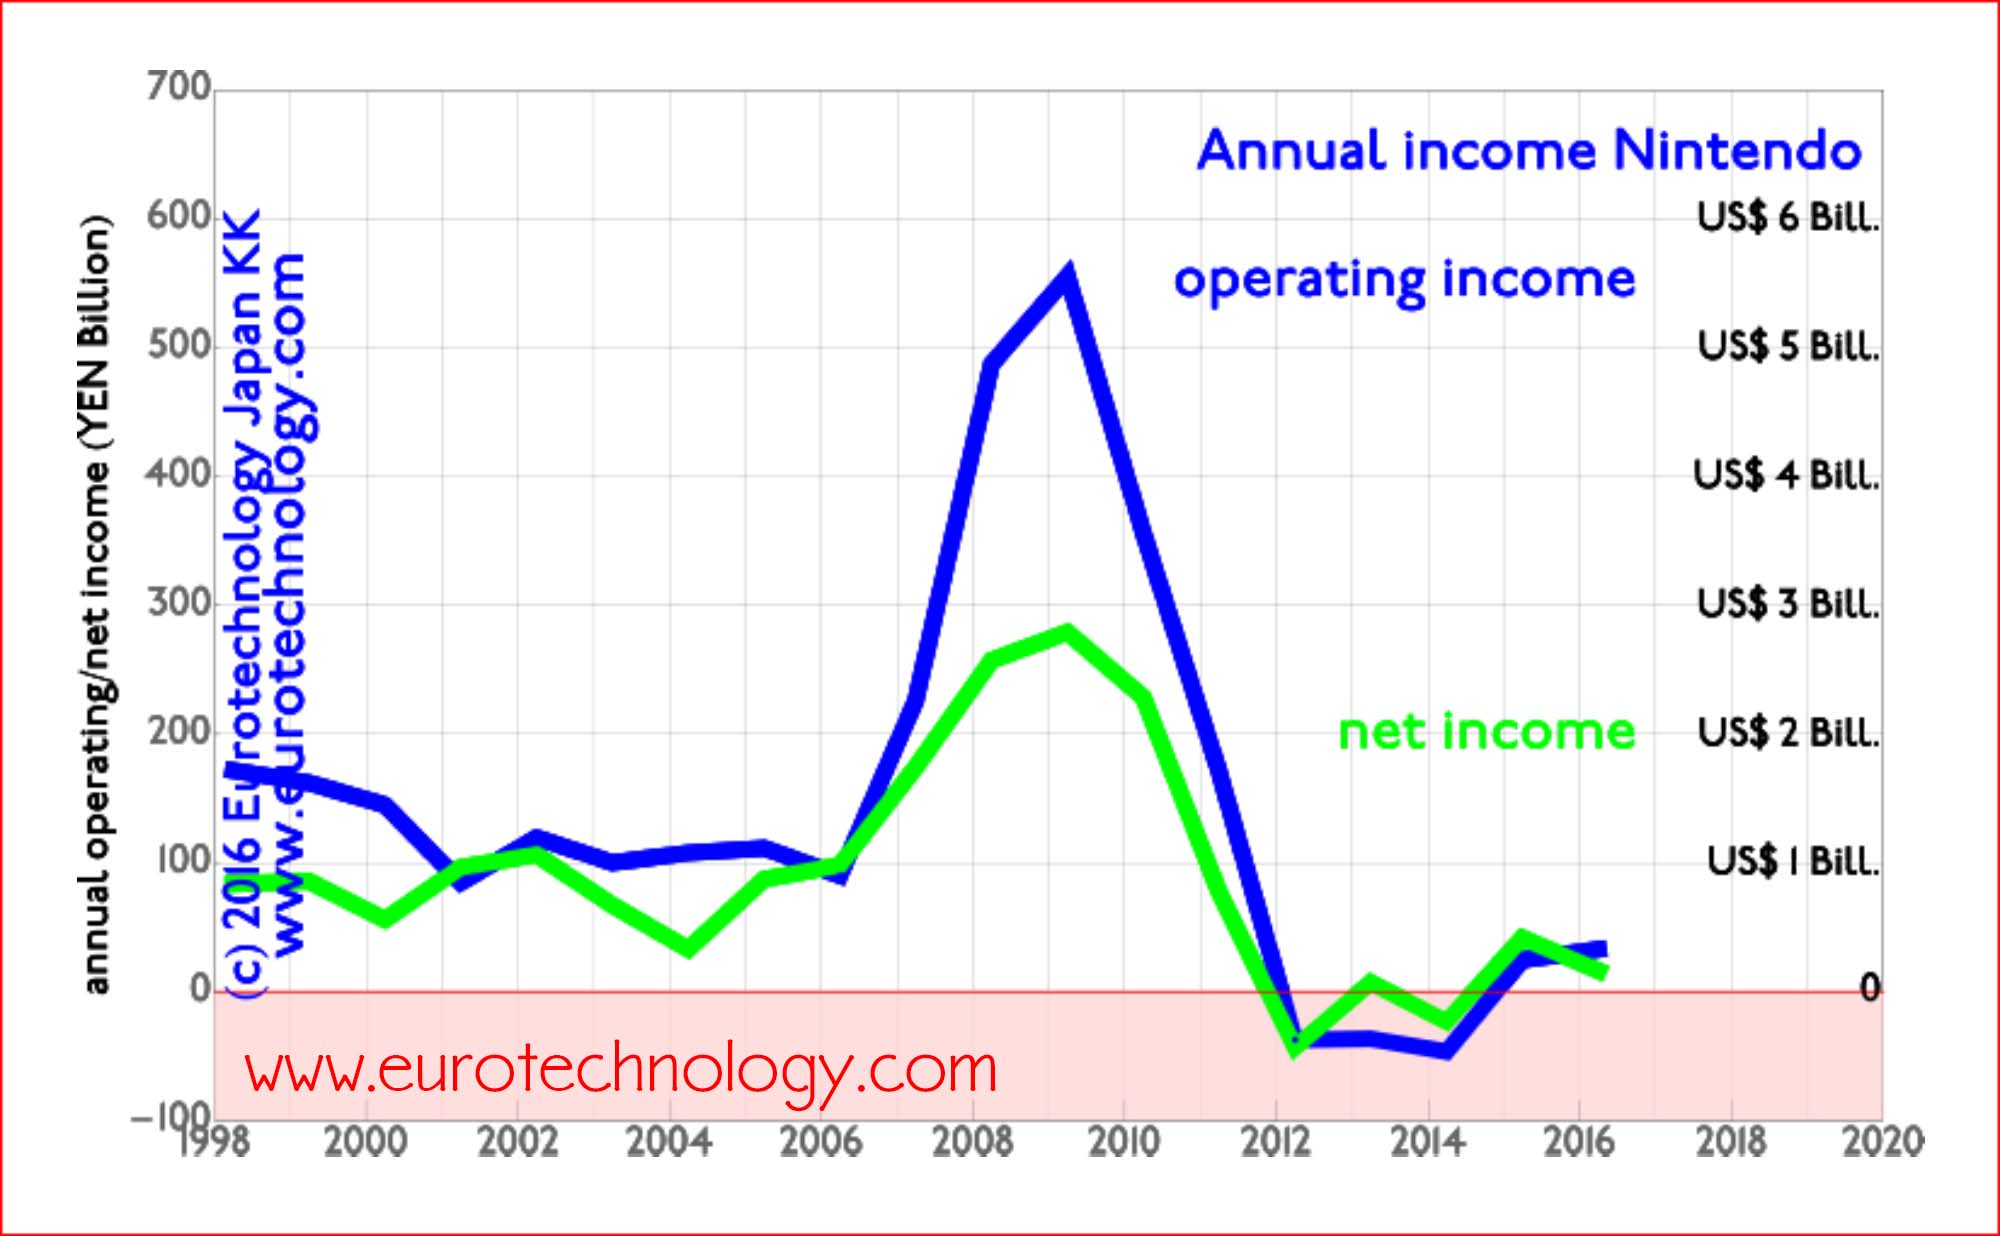
    Nintendo boomed around 2009 by disrupting the game world with motion sensing Wii and two-screen handheld DS game consoles. Smartphone disruption reduced Nintendo to pre-2006 size in sales, and profits did not yet recover to pre-boom levels.

    Nintendo revenues peaked in 2009, and are now back to where they were before 2006
    Nintendo revenues peaked in 2009, and are now back to where they were before 2006
    Nintendo income peaked in 2009, and just recently recovered from losses - has not yet reached pre-2006 levels
    Nintendo income peaked in 2009, and just recently recovered from losses – has not yet reached pre-2006 levels

    Unexpected consequences- The Bank of Kyoto booms, and Bank of Kyoto’s 4.5% holding in Nintendo is worth more than 1/2 of Bank of Kyotos market cap

    The Bank of Kyoto owns 4.5% of Nintendo, at close on July 13, 2016, this holding is worth YEN 139 billion (US$ 1.4 billion).

    The Bank of Kyoto (TSE Code 8369) at the close on July 13, 2016 has a market cap of YEN 274 billion (US$ 2.64 biliion)

    Thus Bank of Kyoto’s holding in Nintendo corresponds to more than one half of its value. This also means that Nintendo is worth about 10 times as much as the Bank of Kyoto.

    The Pokémon Company – global market size estimate for Pokémon characters estimate: US$ 48 billion

    The Pokémon Company manages and develops the currently 740 Pokémon characters.

    The Pokémon Company is a private company owned in equal 1/3 parts by Nintendo KK, KK Game Freek and KK Creatures. KK Game Freek and KK Creatures are both privately held game development companies

    More details and analysis in our Report on Japan’s game markets and makers.

    Niantic Labs

    Niantic Labs, focused on augmented reality games, is a Google spin-out founded in 2010, headed by John Hanke, one of the founders of Keyhole, which is at the basis of Google Earth.

    Niantic Labs had staged initial funding of US$ 90 million equally from Google (1/3), Nintendo (1/3) and The Pokémon Company (1/3), and since then an additional Series A round in February 2016, plus we assume that Founder John Hanke, maybe Google at spin-out, other founders likely also own equity. So its not clear to us how much exactly Nintendo owns of Niantec, either directly or via its holding in the Pokémon Company.

    There was a augmented reality company in Japan, Tonchi-Dot 頓智ドット株式会社(トンチドット) which created a augmented reality app called Sekai-Camera during i-Mode and Galake-Phones, but it ended all services on January 22nd, 2014.

    Japan game market disruption market report:

    Copyright (c) 2016-2019 Eurotechnology Japan KK All Rights Reserved

  • Japan mobile operators grow to US$ 25 billion in operating profits for FY2014 (ended March 31, 2015)

    Japan mobile operators grow to US$ 25 billion in operating profits for FY2014 (ended March 31, 2015)

    Annual revenues exceed US$ 170 billion in FY2014

    Japan’s mobile telecommunications sector continues to grow

    The global mobile internet and smartphone revolution started in Japan in 1999, and Japan’s mobile telecommunications market is the world’s most advanced and most vibrant. Much mobile innovation and inventions, such as camera phones, color screens for mobile phones, mobile apps (i-Appli in Japan), and mobile payments were invented and first to market in Japan.

    Globally the first mobile internet started in Japan in February 1999 when NTT-Docomo brought i-Mode to market. NTT-Docomo did not succeed to develop global business based on i-Mode, however, SoftBank took the lead, and is now building a global business built on Japan’s telecommunications sector’s strengths.

    To understand Japan’s telecommunications market read our report:

    Japan mobile operators grow revenues to over US$ 170 billion in FY2014

    While former monopoly operator NTT-Docomo’s business continues to shrink since its peak in 2002, KDDI is growing its predominantly domestic Japanese business slowly but steadily.

    SoftBank on the other hand drives rapid growth with domestic Japanese acquisitions (Vodafone-Japan, Japan Telecom, eMobile and Willcom) and overseas acquisitions, which include US operator SPRINT, US mobile phone retailer BrightStar, Finnish game company SuperCell and many others – not to mention SoftBank’s investment in Alibaba.

    Japan's top three mobile operators combined revenues grow to over US$ 170 billion
    Japan’s top three mobile operators combined revenues grow to over US$ 170 billion

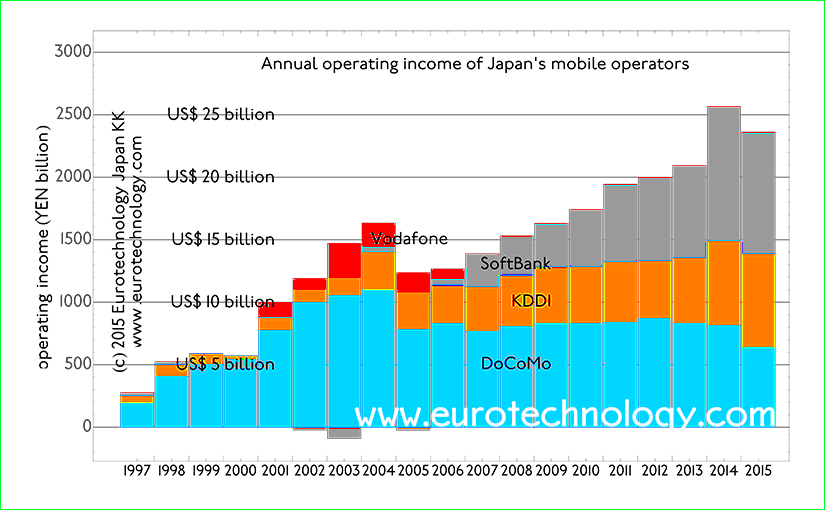
    Operating profits rise to approx. US$ 25 billion in FY2014

    Operating profits and net profits are steadily increasing for Japan’s three mobile operators combined.

    Former monopoly operator NTT-Docomo’s operating profits peaked in 2002, and have been steadily decreasing since this peak.

    Both challengers KDDI and SoftBank on the other hand are growing operating profits steadily: KDDI mainly domestically in Japan, with relatively small global business, while SoftBank has dramatically increased business outside Japan with a series of acquisitions and investments, including US operator Sprint, US mobile phone distributor BrightStar and Finnish game developer SuperCell.

    Operating income of Japan's three mobile operators combined increases to approx. US$ 25 billion
    Operating income of Japan’s three mobile operators combined increases to approx. US$ 25 billion

    To understand Japan’s telecommunications market read our report:

    Copyright 2015 -2019 Eurotechnology Japan KK All Rights Reserved

  • Japan top grossing smartphone apps

    Japan top grossing smartphone apps

    5 top listed smartphone app companies have combined market cap of US$ 14 billion (excluding LINE)

    LINE is currently a private company and LINE’s company value is generally estimated in the US$ 10-15 billion range, so if we include LINE, the combined market value of Japan’s top 5 smartphone game companies is on the order of US$ 24 – 29 billion.

    Top grossing apps in Japan’s iPhone and Google Play/Android app stores on June 6, 2015

    Japan’s smartphone app market is the world’s largest in terms of cash revenues according to AppAnnie. Lets analyze which apps are at the top-grossing in the world’s largest app market.

    Japan game market report (398 pages, pdf-file)

    iPhone app store top grossing ranking (June 6, 2015)

    1. Monster Strike by MIXI
    2. Puzzle & Dragons by GungHo
    3. Final Fantasy Record Keeper by DeNA
    4. LINE by LINE Corporation
    5. Actual powerful pro baseball by KONAMI
    6. all 25 top-grossing iPhone apps on June 6, 2015

    Google Play Android app store top grossing ranking (June 6, 2015)

    1. Monster Strike by Mixi
    2. Puzzle & Dragons by GungHo
    3. LINE Disney tsumu tsumu by LINE Corporation and Walt Disney Corporation
    4. White Cat Project by Colopl Inc.
    5. Sword and sorcery. Logres of Swords and Sorcery – original popular online RPG by Marvelous Inc.
    6. all 25 top-grossing Google-Play store Android apps on June 6, 2015

    Market capitalization of the companies involved:

    • Mixi: YEN 443 billion (US$ 3.5 billion)
    • GungHo: YEN 580 billion (US$ 4.6 billion)
    • LINE: unlisted
    • Konami: YEN 324 billion (US$ 2.6 billion)
    • Colopl: YEN 312 billion (US$ 2.5 billion)
    • Marvelous: YEN 86.8 billion (US$ 0.7 billion)

    Analyzing the market capitalization of these companies, it is obvious that a large part – or all – of the value is in the smartphone games.

    As an example, Mixi’s core business was the mixi Social Network, which lost weight with the success of Facebook in Japan, until the breakthrough success of its Monster Strike game during FY2014.

    How are foreign companies doing in Japan’s smartphone app market?

    Disney achieved consistently high rankings in cooperation with LINE for the tsumu-tsumu game.

    Next highest ranking foreign game is the Finland based, 73.2% SoftBank owned, Clash of Clans by Supercell on rank 12.

    Japan game market report (398 pages, pdf-file)

    Copyright (c) 2015-2019 Eurotechnology Japan KK All Rights Reserved

  • Japan Google Play top grossing Android apps

    Japan Google Play top grossing Android apps

    25 Japan Google Play top grossing Android Apps of June 6, 2015 (All Categories)

    Japan game market report (398 pages, pdf-file)

    1. No. 1 Monster strike (by Mixi)
    2. No. 2 Puzzle & Dragons by GungHo
    3. No. 3「LINE: ディズニーツムツム」LINE Disney tsumu tsumu (by LINE Corporation & Disney)
    4. No. 4「白猫プロジェクト」”White Cat project” by COLOPL Inc.
    5. No. 5 「剣と魔法のログレスいにしえの女神・人気の本格オンラインRPG」Sword and sorcery. Logres of Swords and Sorcery – original popular online RPG by Marvelous Inc.
    6. No. 6 「クイズRPG 魔法使いと黒猫のウィズ」”Quiz RPG magic using black cat whiz” by COLOPL Inc.
    7. No. 7 「グランブルーファンタジー】」Grandblue Fantasy by Cygames Inc. (Cygames is a joint-venture company between CyberAgent (74.04%) and DeNA (24.03%), originally founded in May 2011 as a subsidiary of CyberAgent Corporation)
    8. No. 8 LINE PokoPoko by LINE Corporation
    9. No. 9 LINE by LINE Corporation
    10. No. 10 FINAL FANTASY Record Keeper by DeNA
    11. No. 11「実況パワフルプロ野球」”Actual powerful pro base ball” by KONAMI
    12. No. 12 Clash of Clans by Supercell. Supercell is now valued at US$ 5.3 billion and 73.2% owned by SoftBank.
    13. No. 13「ファントム オブ キル」”Phantom of the Kill” by gumi Inc.
    14. No. 14 Love life! School Idol Festival by KLab Inc.
    15. No. 15 OnePiece Treasure Cruise (by Bandai Namco Entertainment Inc)
    16. No. 16 LINE POP2 by LINE Corporation
    17. No. 17「スクールガールズストライカーズ」”Schoolgirl strikers” by Square Enix Ltd.
    18. No. 18 Dragon poker by Asobism Co Ltd
    19. No. 19 Dragon Quest Monsters Superlight (by Square Enix)
    20. No. 20 「戦国炎舞 ‐KIZNA‐ 【人気の本格戦国RPG】」Sengoku Enbu – KIZNA – (popular true waring states RPG) by Sumzap Inc (株式会社サムザップ) (Sumzap Inc. is a 100% owned subsidiary of CyberAgent Corporation).
    21. No. 21 LINE Rangers by LINE Corporation
    22. No. 22 Summoners War by Com2uS Corporation (a South Korean game developer company)
    23. No. 23 「ブレイブフロンティア 【無料本格RPG-ブレフロ】」 Brave Frontier by Alim Co Ltd
    24. No. 24 「消滅都市」  Extinction capital – Everything in its right place. By Wright Flyer Studios Inc.
    25. No. 25 「ユニゾンリーグ◆-ユニフレと冒険-人気本格オンラインRPG」Unison League – (popular original RPG) by Ateam Inc.

    Japan game market report

    (398 pages, pdf-file)

    Copyright (c) 2015-2019 Eurotechnology Japan KK All Rights Reserved

  • Japan iOS App store 25 top grossing

    Japan iOS App store 25 top grossing

    25 Top Grossing iPhone Apps of June 6, 2015 (All Categories)

    Eurotechnology report: JAPAN’S GAME MAKERS AND MARKETS – DISRUPTION BY SMARTPHONE GAMES
    Eurotechnology report: JAPAN’S GAME MAKERS AND MARKETS – DISRUPTION BY SMARTPHONE GAMES
    1. No. 1 Monster strike (by Mixi)
    2. No. 2 Puzzle & Dragons by GungHo
    3. No. 3 FINAL FANTASY Record Keeper by DeNA
    4. No. 4 LINE by LINE Corporation
    5. No. 5「実況パワフルプロ野球」”Actual powerful pro base ball” by KONAMI
    6. No. 6「LINE: ディズニーツムツム」LINE Disney tsumu tsumu (by LINE Corporation & Disney)
    7. No. 7「チェインクロニクル・本格シナリオRPG/エヒクロ」”Chain chronicle original scenario RPG / Chaincro” by SEGA Corporation
    8. No. 8「白猫プロジェクト」”White Cat project” by COLOPL Inc.
    9. No. 9 Love life! School Idol Festival by KLab Inc.
    10. No. 10 MOBIUS FINAL FANTASY by Square Enix Inc.
    11. No. 11 「剣と魔法のログレスいにしえの女神・人気の本格オンラインRPG」Sword and sorcery. Logres of Swords and Sorcery – original popular online RPG by Marvelous Inc.
    12. No. 12 Clash of Clans by Supercell. Supercell is now valued at US$ 5.3 billion and 73.2% owned by SoftBank.
    13. No. 13 LINE PokoPoko by LINE Corporation
    14. No. 14 「クイズRPG 魔法使いと黒猫のウィズ」”Quiz RPG magic using black cat whiz” by COLOPL Inc.
    15. No. 15 「戦国炎舞 ‐KIZNA‐ 【人気の本格戦国RPG】」Sengoku Enbu – KIZNA – (popular true waring states RPG) by Sumzap Inc (株式会社サムザップ) (Sumzap Inc. is a 100% owned subsidiary of CyberAgent Corporation).
    16. No. 16 Dragon poker by Asobism Co Ltd
    17. No. 17 「グランブルーファンタジー】」Grandblue Fantasy by Cygames Inc. (Cygames is a joint-venture company between CyberAgent (74.04%) and DeNA (24.03%), originally founded in May 2011 as a subsidiary of CyberAgent Corporation)
    18. No. 18 Dragon Quest Monsters Superlight (by Square Enix)
    19. No. 19 OnePiece Treasure Cruise (by Bandai Namco Entertainment Inc)
    20. No. 20 Game of War – Fire Age by Machine Zone Inc. (a Palo Alto based game venture company)
    21. No. 21 Summoners War by Com2uS Corporation (a South Korean game developer company)
    22. No. 22 Tsuri Suta (Tsuri = Angling) (by GREE)
    23. No. 23 LINE Manga – free popular manga, daily renewed content by LINE Corporation
    24. No. 24 Hunter x Hunter Battle Allstars (by NamcoBandai Games Inc)
    25. No. 25 Puyo puyo!! Quest (by Sega Corporation)

    Japan game market report (398 pages, pdf-file)

    Japan smartphone game business
    Japan smartphone game business

    Copyright 2015 -2019 Eurotechnology Japan KK All Rights Reserved

  • Smartphone games disrupt Japanese video game industry

    Smartphone games disrupt Japanese video game industry

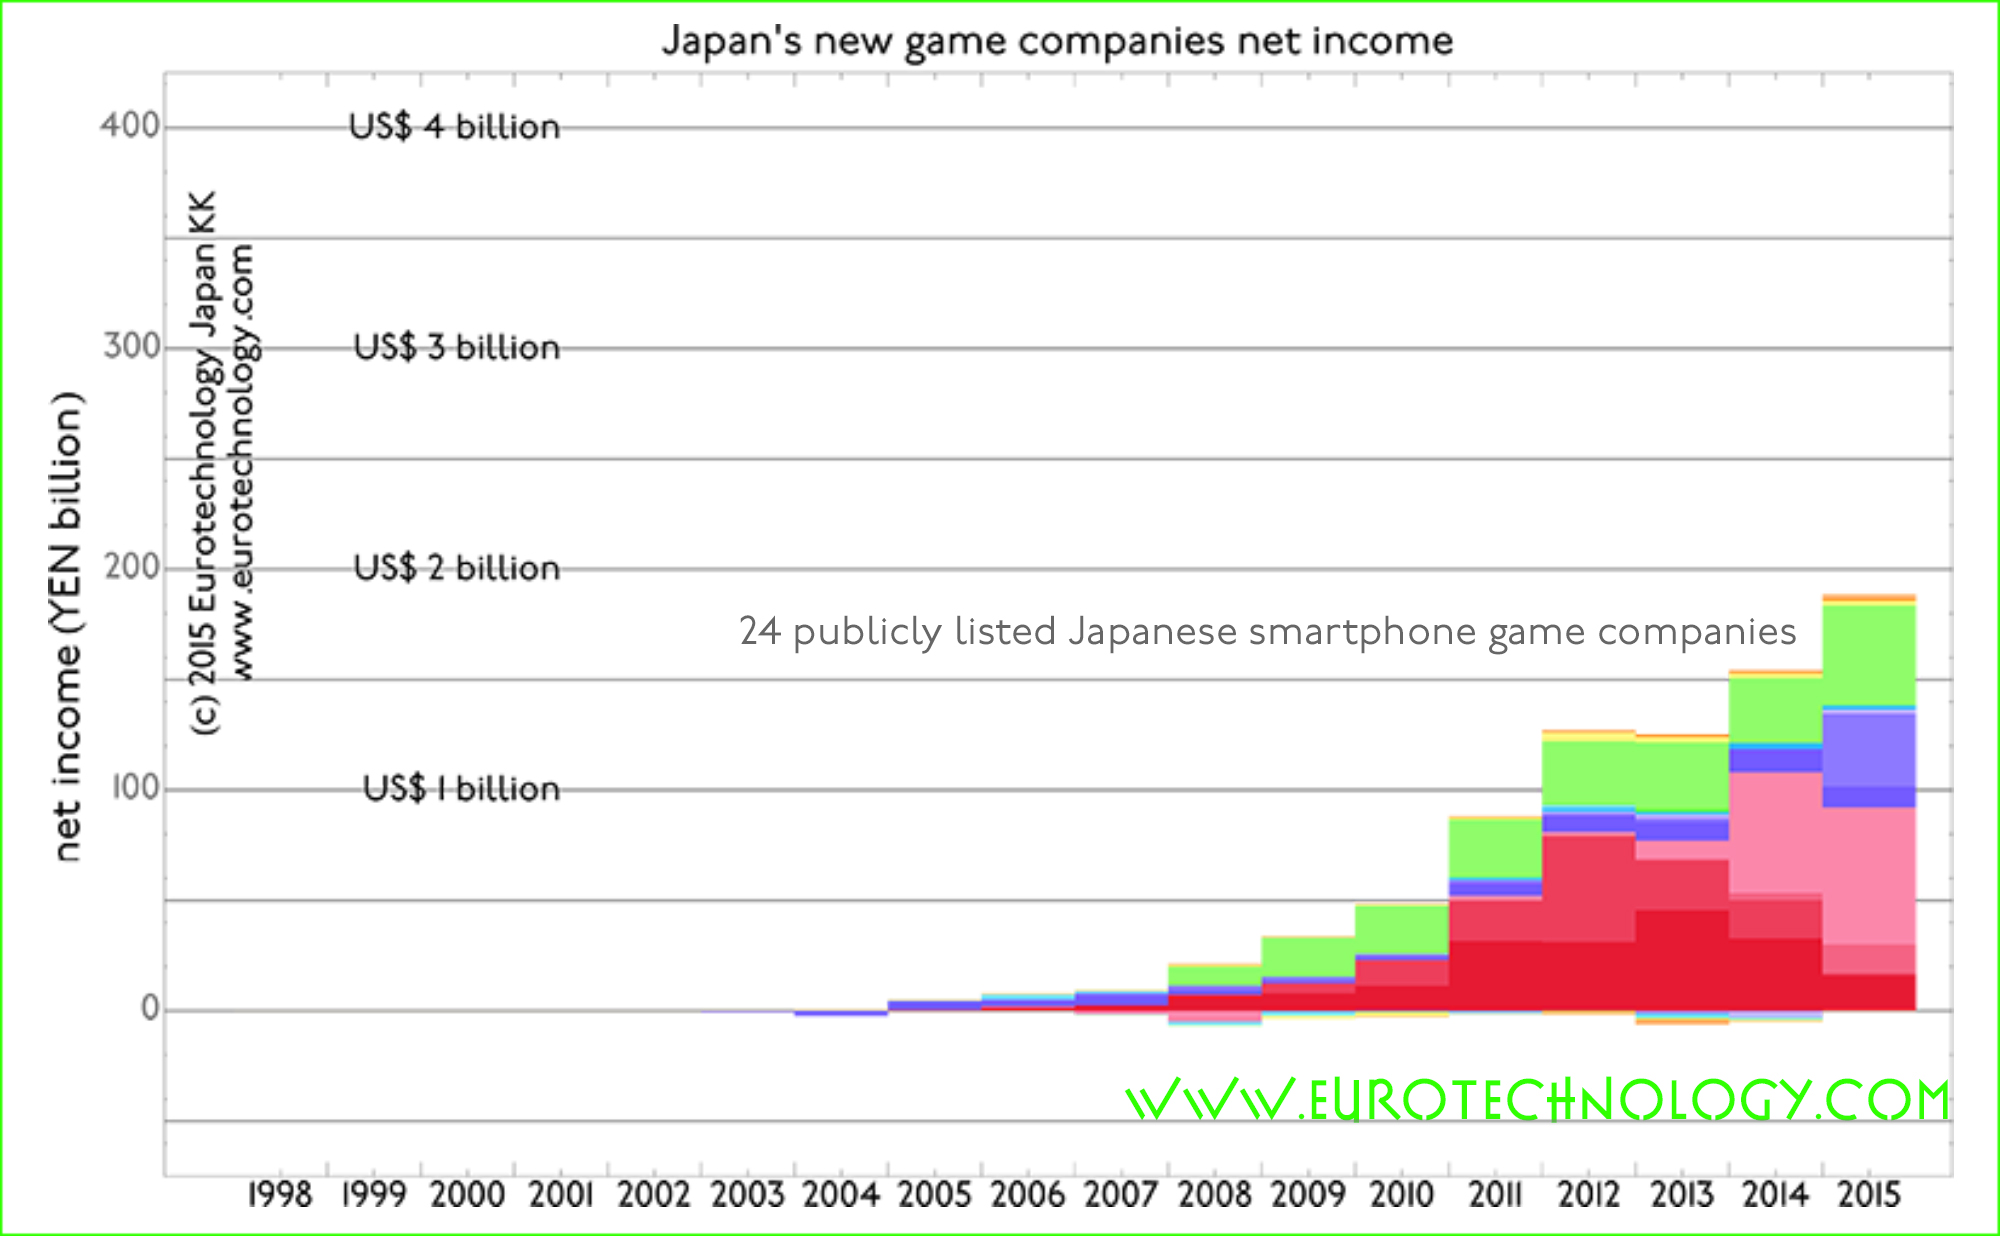
    24 new listed smartphone game companies achieve net income twice as high as all top 8 traditional video game companies combined

    Its not just Nintendo being disrupted, its the whole Japanese video games industry

    In the most recent version of our report on Japan’s game industry, we added 24 publicly listed new smartphone game companies (listed on the Mothers market or the second or first sections of the Tokyo Stock Exchange), and we also added not-yet-publicly-traded LINE, and we will add more in future editions.

    Japan game market report (398 pages, pdf-file):

    There has been much media focus on Nintendo and how it is affected by the rise of smartphone freemium games, and how it will react. But our analysis shows that its not just Nintendo thats affected, but the whole traditional Japanese video game industry.

    Smartphone games disrupt:

    During financial year just ended, 24 publicly listed Japan’s smartphone game companies earned twice as much income as all top 8 traditional video game companies combined.

    Combined net income in FY2014 (which for most companies ended on March 31, 2015) for 24 publicly listed Japanese new smartphone game companies is about YEN 200 billion (about US$ 2 billion), compared to a combined net income of about YEN 100 billion (about US$ 1 billion) for all top 8 traditional Japanese video game companies:

    net income of Japan's top 8 traditional video game companies is about US$ 1 billion in FY2014
    net income of Japan’s top 8 traditional video game companies is about US$ 1 billion in FY2014 (source: official company financial reports)
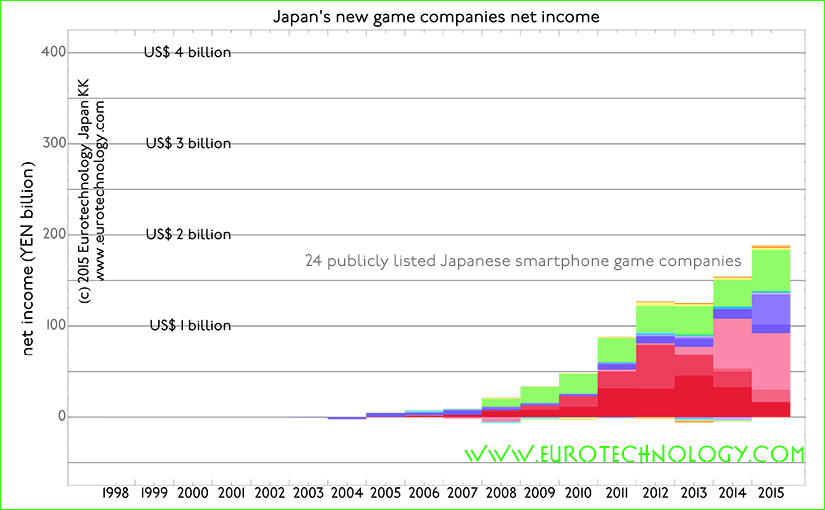
    net income of 24 listed Japanese new smartphone game companies combined in FY2014 is about US$ 2 billion
    net income of 24 listed Japanese new smartphone game companies combined in FY2014 is about US$ 2 billion (source: official company financial reports)

    Japanese smartphone games have global impact and capture global value

    Japanese smartphone game companies are in leading positions on global scale (Source: AppAnnie):

    • The globally No. 1 ranked top grossing company for iOS and Google-Play app stores combined is a Japanese company: LINE
    • 2 out of the top-10 top-grossing smartphone game companies globally (iOS plus Google-Play app stores combined) are Japanese companies
    • 5 out of the top-10 top-grossing apps globally (iOS plus Google-Play app stores combined) are Japanese apps

    Learn more about Japan’s games industries

    Japan game market report (398 pages, pdf-file)

    Copyright 2015 Eurotechnology Japan KK All Rights Reserved

  • Nintendo smartphone pivot?!

    Nintendo partners with DeNA

    Taking Nintendo intellectual property and characters to smartphones

    Nintendo was founded on September 23, 1889 by Fujasiro Yamauchi in Kyoto for the production of handmade “hanafuda” cards. Nintendo Headquarters are still located in Kyoto (you can see the Nintendo headquarters building from the Kyoto railway station).

    The Chinese characters used to write Nintendo’s original Japanese company name in Japanese mean something like “leave the responsibility to heaven or to god”.

    Nintendo has been through many pivots during its more than 100 years history, and Nintendo can afford to take its time to do things right, and it did when smartphones started disrupting industry sector after industry sector, and did not stop disrupting the games industry.

    Nintendo has a home advantage – the epicenter of the global games industry is in Japan, and not surprisingly, Japan is by far the world’s No. 1 biggest smartphone games market by cash income (other markets are bigger in terms of free downloads, but Japan is No. 1 globally in terms of cash revenues). So Japanese game companies have a big home advantage.

    The No. 1 company ranked by gross revenues of the combined total iPhone + Android app market is also a Japanese company.

    Yesterday, March 18, 2015, Nintendo announced to join forces with DeNA to jointly develop smartphone games including subscription based game services as a platform to leverage Nintendo’s iconic intellectual properties and characters.

    Do you understand the big picture of Japan’s games industries, which drive the global game market? Make sure you do – and read our report:

    Copyright 2015 Eurotechnology Japan KK All Rights Reserved

  • Google Play Japan – top grossing Android Apps ranking

    Google Play Japan – top grossing Android Apps ranking

    Android smart phone apps ranking in Japan by gross revenues (Feb. 18, 2015)

    Japan game market report (398 pages, pdf-file)

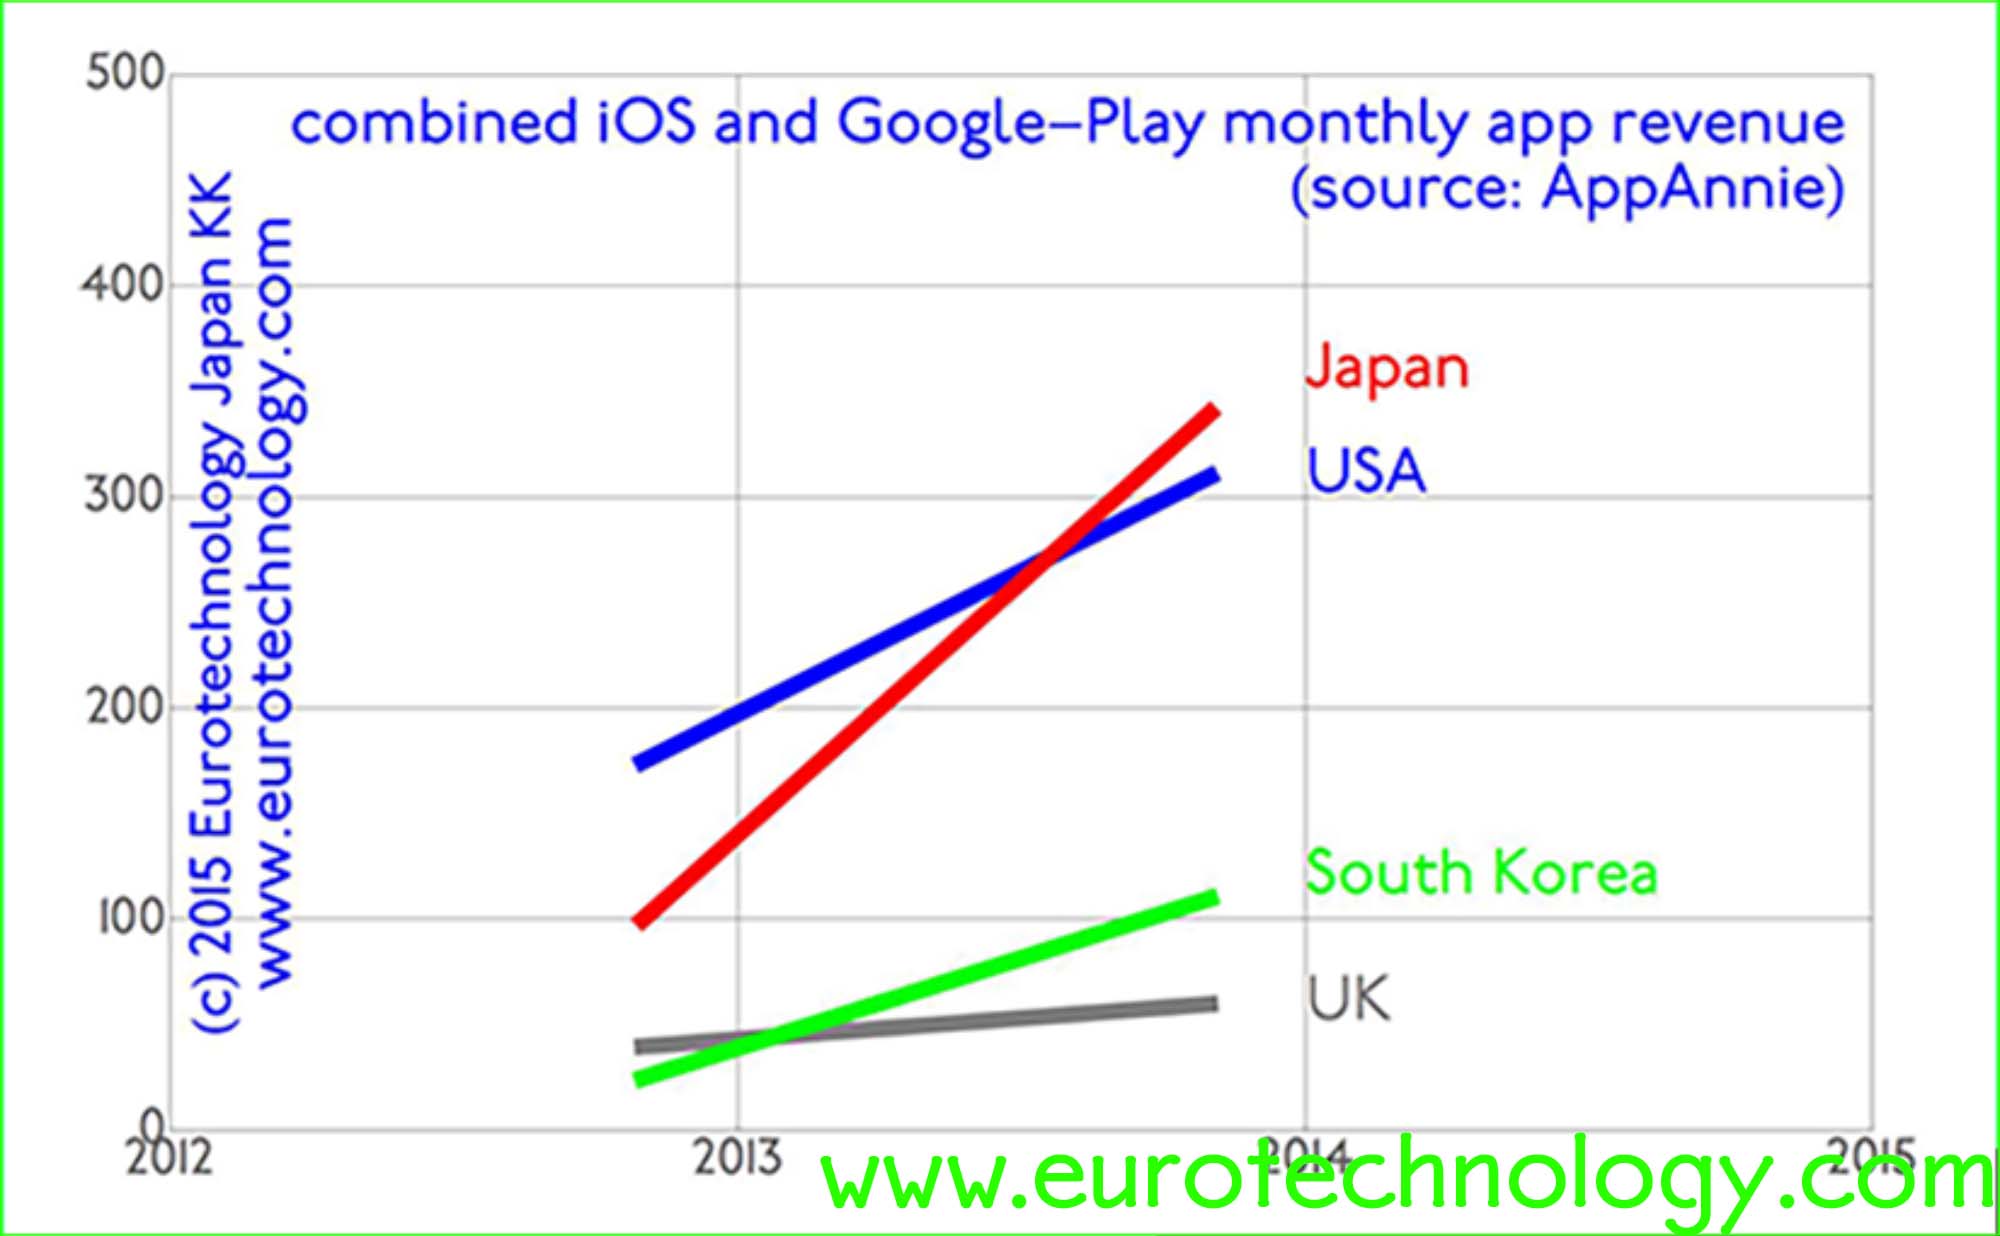
    AppAnnie showed that in terms of combined iOS AppStore + Google Play revenues, Japan is No. 1 globally, spending more than the USA. Therefore Japan is naturally the No. 1 target globally for many mobile game companies!

    Eurotechnology report: JAPAN’S GAME MAKERS AND MARKETS – DISRUPTION BY SMARTPHONE GAMES
    Eurotechnology report: JAPAN’S GAME MAKERS AND MARKETS – DISRUPTION BY SMARTPHONE GAMES

    Android Google Play – Japan “Top Grossing” apps ranking of February 18, 2015:

    Note that the Android/Google Play ranking shown here is very similar to the iOS top grossing ranking.

    • No. 1 Puzzle & Dragons by GungHo
    • No. 2 Monster strike (by Mixi)
    • No. 3 白猫プロジェクト (= white cat project) (by Colopl Inc.)
    • No. 4 クイズRPG 魔法使いと黒猫のウィズ (= Quiz RPG (role playing game) The World of Mystic Wiz, the which and the black cat wiz) (by Colopl Inc.)
    • No. 5 LINE Disney tsumu tsumu (by LINE Corporation) (ツムツム = Tsum Tsum)
    • No. 6 LINE PokoPoko (by LINE Corporation)
    • No. 7 Dragon Quest Monsters Superlight (by Square Enix)
    • No. 8 LINE (by LINE Corporation)
    • No. 9 Final Fantasy Record Keeper (by DeNA Ltd)
    • No. 10 LINE Rangers (by LINE Corporation)
    • No. 11 Love life! School Idol Festival (by KLab Inc.)
    • No. 12 Logres of Swords and Sorcery – popular online RPG (by Marvelous Inc.)
    • No. 13 Runaway lives motorcycle Tiger (by Donuts Co Ltd)
    • No. 14 Clash of Clans (by Supercell)
    • No. 15 Chain chronicle – real scenario RPG (ChainChro = チェンクロ) (by SEGA Corporation)
    • No. 16 Actual powerful pro-baseball (実況パワフルプロ野球) (by KONAMI)
    • No. 17 Schoolgirl strikers (by Square Enix)
    • No. 18 Puyo puyo!! Quest (by Sega Corporation)
    • No. 19 LINE POP2 (by LINE Corporation)
    • No. 20 Granblue Fantasy (by Cygames Inc)
    • No. 21 Drift Spirits (by Bandai Namco Games Inc)
    • No. 22 Pro baseball Pride 2014 (by Colopl Inc.)
    • No. 23 Sengoku Enbu – KIZNA – (by Sumzap Inc)
    • No. 24 Dragon poker (by Asobism Co Ltd)
    • No. 25 Gandam Conquest (by Bandai Namco Games Inc)

    Japan’s iconic game companies created many game categories – this tradition carries over to mobile gaming now.

    Japan game market report (398 pages, pdf-file)

    Copyright 2015 Eurotechnology Japan KK All Rights Reserved

  • Japan smartphone app rankings by cash revenue (iOS)

    Japan smartphone app rankings by cash revenue (iOS)

    Top grossing app ranking (Feb. 10, 2015)

    AppAnnie showed that in terms of combined iOS AppStore + Google Play revenues, Japan is No. 1 globally, spending more than the USA. Therefore Japan is naturally the No. 1 target globally for many mobile game companies, and quite a few of the top grossing apps in Japan are of foreign origin – can you guess which?!

    Japan game market report (398 pages, pdf-file)

    iOS AppStore-Japan “Top Grossing” ranking of February 10, 2015:

    Note that the iOS ranking shown here is very similar to the Android / Google Play top grossing ranking.

    • No. 1 Monster strike (by Mixi) from rank 2 on July 13, 2014
    • No. 2 Puzzle & Dragons by GungHo (from rank 1 on July 13, 2014)
    • No. 3 白猫プロジェクト (= white cat project) (by Colopl Inc.)
    • No. 4 Dragon Quest Monsters Superlight (by Square Enix) (from Rank 12 on July 13, 2014)
    • No. 5 LINE Disney tsumu tsumu (by LINE Corporation) (ツムツム = Tsum Tsum) (from Rank 3 on July 13, 2014)
    • No. 6 Final Fantasy Record Keeper (by DeNA Ltd)
    • No. 7 LINE (by LINE Corporation)
    • No. 8 Love life! School Idol Festival (by KLab Inc.) (was rank 9 on July 13, 2014)
    • No. 9 LINE PokoPoko (by LINE Corporation)
    • No. 10 Logres of Swords and Sorcery – popular online RPG (by Marvelous Inc.) (was rank 14 on July 13, 2014)
    • No. 11 Clash of Clans (by Supercell) (was rank 5 on July 13, 2014)
    • No. 12 Runaway lives motorcycle Tiger (by Donuts Co Ltd)
    • No. 13 Drift Spirits (by Bandai Namco Games Inc)
    • No. 14 Actual powerful pro-baseball (実況パワフルプロ野球) (by KONAMI)
    • No. 15 Sengoku Enbu – KIZNA – (by Sumzap Inc) (was rank 8 on July 13, 2014)
    • No. 16 Sword Art Online Code Resister (by Bandai Namco Games Inc)
    • No. 17 Chain chronicle – real scenario RPG (ChainChro = チェンクロ) (by SEGA Corporation)
    • No. 18 Schoolgirl strikers (by Square Enix)
    • No. 19 Summons Board (by GungHo Online Entertainment)
    • No. 20 Puyo puyo!! Quest (by Sega Corporation) (was rank 11 on July 13, 2014)
    • No. 21 Granblue Fantasy (by Cygames Inc)
    • No. 22 LINE Manga – daily reload of popular manga free of charge (by LINE Corporation)
    • No. 23 Brave frontier (by Alim Co Ltd) (was rank 4 on July 13, 2014)
    • No. 24 Dragon poker (by Asobism Co Ltd) (was rank 6 on July 13, 2014)
    • No. 25 LINE POP2 (by LINE Corporation)

    Japan game market report (398 pages, pdf-file)

    Copyright 2015-2019 Eurotechnology Japan KK All Rights Reserved

  • Japan iPhone AppStore: world’s top grossing!

    Japan iPhone AppStore: world’s top grossing!

    iPhone AppStore-Japan “Top Grossing” games ranking of July 13, 2014:

    Japan game market report (398 pages, pdf-file):

    Bold figures show rankings in February 2014

    1. No. 1 Puzzle & Dragons by GungHo
    2. No. 2 Monster strike (by Mixi)
    3. No. 3 LINE Disney tsumu tsumu (by LINE Corporation & Disney) (Tsum Tsum) (was rank 23)
    4. No. 4 Brave frontier (by Alim Co Ltd) (was rank 19)
    5. No. 5 Clash of Clans (by Supercell) (was rank 13)
    6. No. 6 Dragon poker (by Asobism Co Ltd) (was rank 17)
    7. No. 7 Tsuri Suta (by GREE) (same rank 7)
    8. No. 8 Sengoku Enbu – KIZNA – (by Sumzap Inc, subsidiary of CyberAgent) (was rank 8)
    9. No. 9 Love life! School Idol Festival (by KLab Inc) (was rank 14)
    10. No. 10 LINE Rangers (by LINE Corporation)
    11. No. 11 Puyo puyo!! Quest (by Sega Corporation) (was rank 9)
    12. No. 12 Dragon Quest Monsters Superlight (by Square Enix) (was rank 3)
    13. No. 13 Ange Vierge – No. 2 Public Morals Committee Member girls battle (by Sega Corporation)
    14. No. 14 Logres of Swords and Sorcery – popular online RPG (by Marvelous Inc.)
    15. No. 15 Pro yakiyu PRIDE (by Colopl Inc) (was rank 6)
    16. No. 16 Merc Storia (by Happy Elements KK)
    17. No. 17 Candy Crush Saga (by King.com Ltd) (was rank 15)
    18. No. 18 OnePiece Treasure Cruise (by Bandai Namco Games)
    19. No. 19 SG GUNDAM GENERATION FRONTIER (by Bandai Namco Games)
    20. No. 20 Summoners War: Sky Arena (by Com2u2 Corp., a South Korean game company)
    21. No. 21 Quiz RPG Witch and black cat quiz (by Colopl) (was rank 2)
    22. No. 22 LINE Pokopang (by LINE Corporation (was rank 5)
    23. No. 23 World soccer collection S (by KONAMI) (was rank 24)
    24. No. 24 Frozen Free Fall (by Disney)
    25. No. 25 Gundam Area wars (by NamcoBandai Games Inc) (was rank 18)

    Dropped out of the top 25 since February 2014:

    • February 2014:No. 10 Gunzei RPG aoi no sangokushi (by Colopl)
    • February 2014: No. 11 Bousou retsuden tansha tora (by Donuts Ltd) (a motobicycle race game)
    • February 2014: No. 12 Dragon league X (by Asobism Co Ltd)
    • February 2014: No. 20 Chain cronicle. Original scenario RPG. Chencro (by SEGA Corporation)
    • February 2014: No. 21 LINE Play (by LINE Corporation)
    • February 2014: No. 22 LINE Bubble! (by LINE Corporation)
    • February 2014: No. 25 Hay Day (by Supercell)

    AppAnnie showed that in terms of combined iOS AppStore + Google Play revenues, Japan is No. 1 globally, spending more than the USA. Therefore Japan is naturally the No. 1 target globally for many mobile game companies, and quite a few of the top grossing apps in Japan are of foreign origin – can you guess which?!

    Japan’s iconic game companies created many game categories – this tradition carries over to mobile gaming now.

    Building a business in Japan is not trivial

    Many foreign game companies have failed and given up. Foreign game companies that have recently given up in Japan include Zynga and Habbo Hotel. EA has given up twice, and is now undertaking the third entry to Japan. To understand some of the key mistakes foreign companies make in Japan, read our blog about why Vodafone failed in Japan.

    Lets have a look at the list of top grossing games in the Apple iOS AppStore today. Out of the 25 top grossing games in the AppStore, quite a few are by foreign originating companies. Can you guess which these are by reading the list above?

    Japan is certainly not a “closed market”. It is obvious that Apple does not discriminate in any way against foreign companies in Japan – and neither do Japanese consumers!

    Interestingly, neither Nintendo, nor Rovio’s games, such as Angry Birds appear among the 200 “top grossing games” in Apple’s iOS Japan AppStore.

    Japan game market report (398 pages, pdf-file):

    Copyright (c) 2014-2019 Eurotechnology Japan KK All Rights Reserved

  • Top Japanese game companies

    Top Japanese game companies

    25 listed top game companies listed on Tokyo Stock Exchange have total market cap of US$ 30 billion

    Japan game market report (398 pages, pdf-file):

    Japan is the cradle of many global games

    Japan created much of today’s global game market with icon’s such as Nintendo. However, today the moment has been taken over by new online game companies. Their combined income now exceeds the traditional icons.

    Top Japanese game companies: disruption by newcomers making mobile apps

    We wrote in our blog first back in 2009 about the disruption of Nintendo’s blue ocean (Wii and DS) by smartphone app stores.

    Top Japanese game companies: top 25 public game companies have added market cap of US$ 30 billion

    Today, 25 Japanese online game companies listed on the Tokyo Stock Exchange, have a combined market cap of about YEN 3000 billion (US$ 30 billion).

    These are (data of May 9, 2014):

    1. Konami (TSE Code 9766)
    2. DeNA (TSE Code 2432) market cap = YEN 246 billion (US$ 2.5 billion)
    3. Gree (TSE Code 3632) market cap = YEN 216 billion (US$ 2.2 billion)
    4. Square Enix Holdings (TSE Code 9684)
    5. Capcom (TSE Code 9697)
    6. GungHo (TSE 3765), market cap = YEN 612 billion (US$ 6 billion)
    7. Colopl (TSE Code 3668), Market cap = YEN 257 billion (US$ 2.6 billion)
    8. find the full list in our report on Japan’s game sector

    Total market cap= YEN 2954.2 billion (=US$ 29 billion)

    Top Japanese game companies: list above does not include LINE

    This list does not include LINE, which is a private company, and has built a substantial games business.

    Japan game market disruption – market report:

    Copyright 2014 Eurotechnology Japan KK All Rights Reserved

  • Supercell Japan advertises to improve today’s top-ten rank in Japan’s i-Phone/iOS App-Store

    Supercell Japan advertises to improve today’s top-ten rank in Japan’s i-Phone/iOS App-Store

    Supercell Japan is not satisfied with 10th rank for Clash of Clans in the Japanese iPhone app store…

    by Gerhard Fasol

    Report on Japan’s game makers and game markets

    Japan is the world’s No. 1 top grossing app market both for iOS apps and for Android apps, as we discussed before.

    Supercell Japan: investments by SoftBank and GungHo

    Supercell recently opened operations in Japan, and attracted major investment by SoftBank and SoftBank affiliate Gung-Ho.

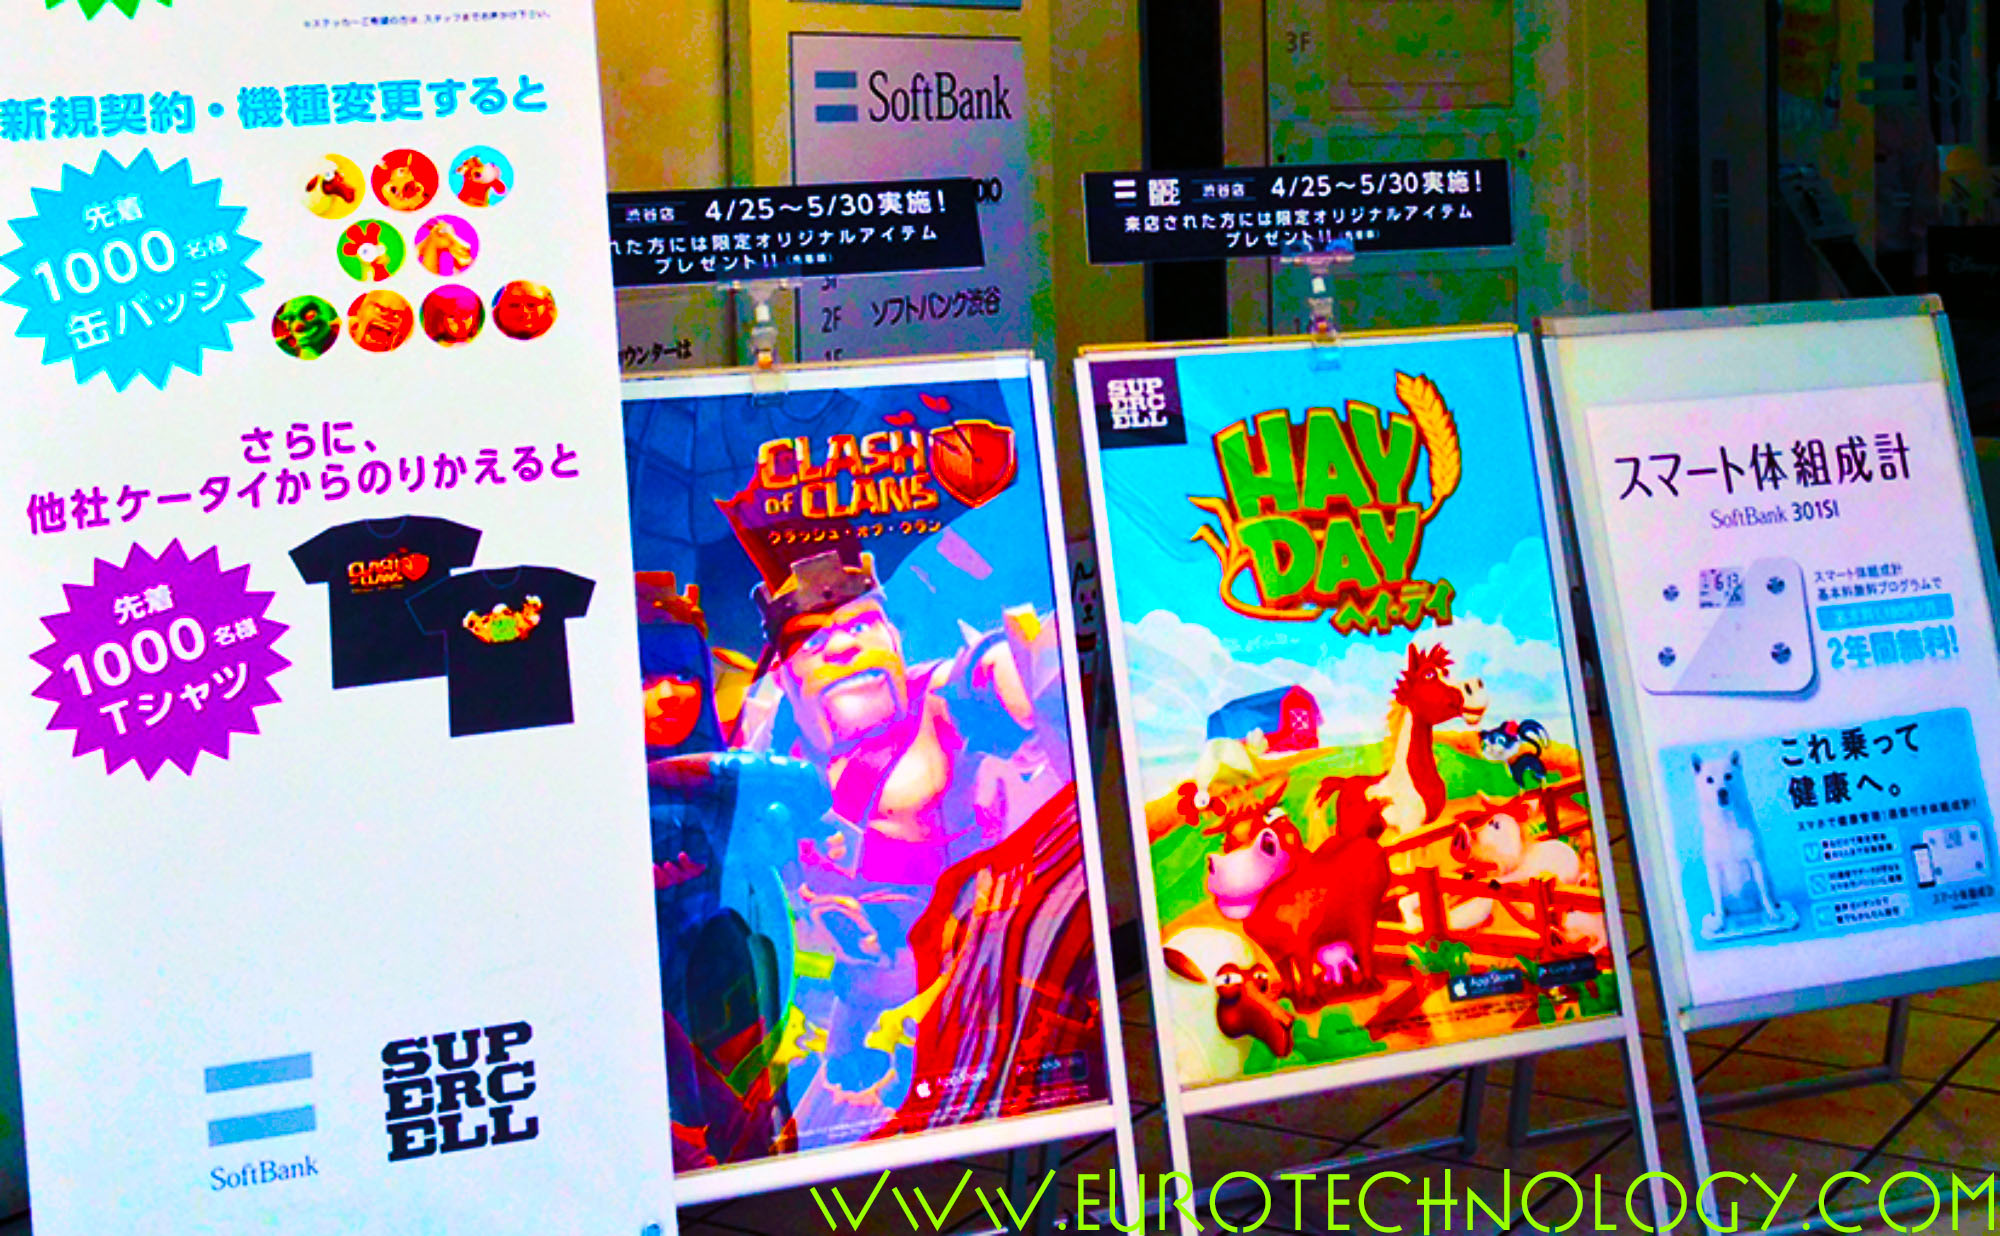
    Supercell advertising Clash of Clans in Tokyo Shibuya - one of the world's busiest rail stations
    Supercell advertising Clash of Clans in Tokyo Shibuya – one of the world’s busiest rail stations

    Supercell currently advertises with large scale posters on the platforms of one of the busiest rail stations globally, Tokyo-Shibuya. Currently Supercell’s “Clash of Clans” is ranked on No. 10 position of top grossing iPhone Apps for all categories combined, while GungHo’s “Puzzle & Dragons” is on No. 1 (Gung-Ho is investor in SuperCell).

    Supercell Japan on rank 10 in the top grossing ranking of the iPhone app store:

    “Top Grossing” ranking in the iPhone AppStore for all categories combined:

    1. Puzzle & Dragon by GungHo Online Entertainment
    2. Monsterstrike by mixi
    3. LINE Pokopang by Naver Japan
    4. Brave Frontier by Alim
    5. PyuoPuyo!! Quest by Sega
    6. Dragon Poker by Asobism
    7. Disney Tsumu Tsumu by Naver Japan
    8. Pro Yakyu Pride 2014 by Colopl
    9. LINE by Naver Japan
    10. Clash of Clans by Supercell
    Clash of Clans advertising on the platform of one of the world's busiest rail stations - Tokyo/Shibuya
    Clash of Clans advertising on the platform of one of the world’s busiest rail stations – Tokyo/Shibuya

    Copyright(c) 2014 Eurotechnology Japan KK All Rights Reserved

  • Japan iPhone AppStore: 10 out of the 25 top grossing apps in Japan are by companies of foreign origin. Can you guess which?

    Japan iPhone AppStore: 10 out of the 25 top grossing apps in Japan are by companies of foreign origin. Can you guess which?

    Japan is No. 1 globally in terms of iOS AppStore + Google Play revenues, bigger and faster growing than USA

    10 out of 25 top grossing apps in Japan are of foreign origin

    Japan game market report (398 pages, pdf-file)

    AppAnnie showed that in terms of combined iOS AppStore + Google Play revenues, Japan is No. 1 globally, spending more than the USA. Therefore Japan is naturally the No. 1 target globally for many mobile game companies, and 10 out of 25 top grossing apps in Japan are of foreign origin!

    Japan’s iconic game companies created many game categories – this tradition carries over to mobile gaming now.

    Building a business in Japan is not trivial

    Many foreign game companies have failed and given up. Foreign game companies that have recently given up in Japan include Zynga and Habbo Hotel. EA has given up twice, and is now undertaking the third entry to Japan. To understand some of the key mistakes foreign companies make in Japan, read our blog about why Vodafone failed in Japan.

    Lets have a look at the list of top grossing games in the Apple iOS AppStore today. Out of the 25 top grossing games in the AppStore, 10 are by foreign originating companies. Can you guess which these are by reading the list below?

    So Japan is certainly not a “closed market”. Actually, it is obvious that Apple does not discriminate in any way against foreign companies in Japan.

    Interestingly, neither Nintendo, nor Rovio’s games, such as Angry Birds appear among the 200 “top grossing games” in Apple’s iOS Japan AppStore.

    Apple iOS AppStore-Japan “Top Grossing” games ranking – 10 out of the 25 top grossing apps in Japan are by companies of foreign origin

    Can you guess which 10 are by companies of foreign origin?

    (read the rankings on July 13, 2014 here)

    February 4, 2014:

    • No. 1 Puzzle & Dragons by GungHo
    • No. 2 Quiz RPG Witch and black cat quiz (by Colopl)
    • No. 3 Dragon Quest Monsters Superlight (by Square Enix)
    • No. 4 Monster strike (by Mixi)
    • No. 5 LINE Pokopang (by Naver Japan)
    • No. 6 Pro yakiyu PRIDE (by Colopl Inc)
    • No. 7 Tsuri Suta (by GREE)
    • No. 8 Sengoku Enbu (by Sumzap Inc)
    • No. 9 Puyo puyo!! Quest (by Sega Corporation)
    • No. 10 Gunzei RPG aoi no sangokushi (by Colopl)
    • No. 11 Bousou retsuden tansha tora (by Donuts Ltd) (a motobicycle race game)
    • No. 12 Dragon league X (by Asobism Co Ltd)
    • No. 13 Clash of Clans (by Supercell)
    • No. 14 Love life! School Idol Festival (by KLab Inc.)
    • No. 15 Candy Crush Saga (by King.com Ltd)
    • No. 16 LINE (by Naver Japan)
    • No. 17 Dragon poker (by Asobism Co Ltd)
    • No. 18 Gundam Area wars (by NamcoBandai Games Inc)
    • No. 19 Brave frontier (by Alim Co Ltd)
    • No. 20 Chain cronicle. Original scenario RPG. Chencro (by SEGA Corporation)
    • No. 21 LINE Play (by Naver Japan)
    • No. 22 LINE Bubble! (by Naver Japan)
    • No. 23 LINE Disney tsumu tsumu (by Naver Japan)
    • No. 24 World soccer collection S (by KONAMI)
    • No. 25 Hay Day (by Supercell)

    Japan game market report

    (398 pages, pdf-file)

    Copyright (c)2014 Eurotechnology Japan KK All Rights Reserved

  • Flappy bird Angry Birds ultimate Japan game disruption: flappy bird flaps to the top

    Flappy bird Angry Birds ultimate Japan game disruption: flappy bird flaps to the top

    Flappy bird Angry Birds ultimate disruption: flappy bird effortlessly flaps to to the top of ranks, while Angry Birds are watching angrily from the sidelines

    Disruption of Japan’s games sector: in a previous blog post we showed that just three newcomers (Gree + DeNA + Gungho) produce more profits than the top 9 traditional game companies combined.

    Lets look at some more disruption from the perspective of Japan’s iPhone App store. Lets look at Flappy Bird vs Angry Birds…

    Flappy bird Angry Birds ultimate disruption: iOS Japan AppStore “free” games ranking

    February 3, 2014, in the “free” ranking in the games section of the iPhone AppStore, we find LINE dominating.

    And newcomer Flappy Bird has overtaken Angry Birds by a long margin. Angry Birds Go! appears on rank No. 97 – which actually in Japan is not that bad, given the huge revenues in Japan – as App Annie has shown, Japan’s the world’s biggest grossing apps market both for iOS and Android – so No. 97 in the world’s biggest App market is not that bad.

    In a subsequent article we analyze the top grossing 25 apps in the iOS AppStore.

    • No. 1 LINE: Disney tsumutsumu
    • No. 6: LINE SONIC DASH S
    • No. 9: LINE Go!GO!GO!
    • No. 10: LINE PARTY Run
    • No. 17: Puzzle & Dragon by GungHo
    • No. 18: Flappy Bird
    • No. 23: LINE Pokopang
    • No. 30: LINE Dozer
    • No. 97: Angry Birds Go!

    iPhone AppStore “Top Grossing” games ranking

    February 3, 2014:

    • No. 1 Puzzle & Dragons by GungHo
    • No. 2 Quiz RPG Witch and black cat quiz (by Colopl)
    • No. 3 Dragon Quest Monsters Superlight (by Square Enix)
    • No. 4 Monster strike (by Mixi)
    • No. 5 LINE Pokopang (by Naver Japan)
    • No. 6 Pro yakiyu PRIDE (by Colopl Inc)
    • No. 7 Tsuri Suta (by GREE)
    • No. 8 Sengoku Enbu (by Sumzap Inc)
    • No. 9 Puyo puyo!! Quest (by Sega Corporation)
    • No. 10 Gunzei RPG aoi no sangokushi (by Colopl)

    See our following blog for an analysis of the ranking of “top grossing” games in the Japan iOS AppStore.

    Learn more about Japan’s games industries

    Japan game market report (398 pages, pdf-file)

    Copyright 2014 Eurotechnology Japan KK All Rights Reserved

  • Ericsson Mobile Business Innovation Forum – Tokyo

    Ericsson Mobile Business Innovation Forum – Tokyo

    Ericsson Mobile Business Innovation Forum Tokyo:

    summary by Gerhard Fasol

    Ericsson held the Mobile Business Innovation Forum in the Roppongi Hills Tower in Tokyo on October 31 and November 1, 2013 delivering a great overview of the push and pull of the mobile communications industry: technology push, M2M and user pull, as well as how the mobile operators between technology and users can best make customers happy and at the same time monetize their investments, while “Over The Top” (OTT) new comers (Google, YouTube, Amazon.com, Facebook, Twitter and others) seek to disrupt the good old telecommunications world.

    Here some key take-aways, read more below:

    • About 50% of global smartphone, mobile phone and mobile broadband subscriptions are in Asia-Pacific, making Asia-Pacific the most important region in the world, and Japan one of the most important LTE markets.
    • Switch from voice to data is a differentiator: forerunner telcos see rapid growth (10-12% CAGR) for both revenues and EBITDA over the period 2008-2013, while average telcos see stagnation. The key for telcos is to be a forerunner, rather than an average stagnating telco.
    • Many products such as XBOX or Apple’s SIRI are linked via networks to a data center. Networks and data centers are disruptive innovation for games and many other sectors. Maybe cars as well.
    • Open source is coming to software defined networks (SDN), the OpenDayLight community develops software for software defined networks.
    • Software defined networks create virtualized networks, SDN support “network slices” for different applications. API’s open SDNs to users.
    • Manufacturers and other industries have rationalized a long time ago, telcos have not yet rationalized, creating big opportunities.

    For insights and detailed statistics read our reports on Japan’s telecom sector.

    Society in transformation

    Society is transformed by broad band data services.

    Douglas Gilstrap, Chief Strategist, Ericsson
    Douglas Gilstrap, Chief Strategist, Ericsson

    Douglas Gilstrap

    Chief Strategist, Chairman of BU Modems, Ericsson

    Douglas Gilstrap emphasized the increasing importance of software: Ericsson today is the world’s 5th biggest software house.

    Mats H Olsson, Head of Asia-Pacific, Ericsson
    Mats H Olsson, Head of Asia-Pacific, Ericsson

    Mats H Olsson: Overview of mobile communications in Asia-Pacific markets

    Head of Asia-Pacific, Ericsson

    Markets drive data consumption:

    • Japan
      • LTE Penetration: 25%
      • Smartphone Penetration: 76%
      • Mobile Penetration: 118%
    • China
      • LTE Penetration: -%
      • Smartphone Penetration: 29%
      • Mobile Penetration: 90%
    • Australia
      • LTE Penetration: 21%
      • Smartphone Penetration: 60%
      • Mobile Penetration: 134%
    • S-Korea
      • LTE Penetration: 51%
      • Smartphone Penetration: 67%
      • Mobile Penetration: 108%

    LTE Markets – 5 out of 10 top LTE markets globally are in Asia-Pacific, and the top 3 are in Asia-Pacific (however this table shows the percentage penetration, does not reflect market size. In terms of market size, Japan is doubtlessly No.1:

    1. S-Korea: 51% penetration
    2. Singapore: 30%
    3. Japan: 25%
    4. USA: 23%
    5. Australia: 21%
    6. Kuwait: 16%
    7. Sweden: 13%
    8. Canada: 8%
    9. Hong Kong: 6%
    10. Austria: 6%

    Mobile communications will dwarf the PC-world. By 2018 we will expect to have:

    • PCS and tablets: 260 million in APAC (31%) vs 850 million globally
    • smartphone subscriptions: 2.2 billion in APAC (49%) vs 4.5 billion globally
    • mobile broadband subscriptions: 3.5 billion in APAC (50%) vs 7 billion globally
    • mobile phone subscriptions: 4.5 billion in APAC (50%) vs 9 billion globally
    Katsuya Watanabe, Deputy Director General, Information and Communications Bureau, Japan's Ministry for Internal Affairs and Communications (MIC)
    Katsuya Watanabe, Deputy Director General, Information and Communications Bureau, Japan’s Ministry for Internal Affairs and Communications (MIC)

    Katsuya Watanabe (Charley K Watanabe): ICT Growth Strategy for Japan

    Deputy Director-General, Information & Communications Bureau, Ministry of Internal Affairs and Communications (MIC), Japan

    Government of Japan – IT Strategic Headquarters:
    The new internet world had a relatively slow start in Japan. In January 2001 the e-Japan Strategy was formed with the target for Japan to become the world’s most advanced IT nation by 2005, and the IT Strategic Headquarters where formed. In January 2006 the New IT Reform Strategy followed, and in July 2009, the i-Japan Strategy 2015.

    The Ministry of Internal Affairs and Communications (MIC) formulated the u-Japan Policy in December 2004, followed by the x-ICT Vision in July 2008.

    With the change of Government in September 2009, the New Strategy in Information and Communications Technology formulated.

    With the advent of Prime Minister Abe’s Government in December 2012, in June 2013, the new IT Strategy was formulated: “The world’s most advanced IT nation creation”, by the Council on ICT Strategy and Policy for Growth, which was set up in February 2013.

    The Ministry focuses on the following trends: Big Data, Sensor Networks, Cloud Computing, and smart phones.

    • Mission: to be the most active country in the world.
    • Vision:
      1. Creating new value-added industries
      2. Solving social problems
      3. Improving and strengthening common ICT infrastructure
    • Issues: economic growth, employment, information transmission capacity, development of cities, super-aging society, resource problems, open innovation, cybersecurity, utilization of personal data

    Prioritized projects are:

    • Creating new value-added industries:
      • data utilization
      • broadcast and contents
      • agriculture
      • local revitalization
    • Solving social problems:
      • Disaster prevention
      • Medical, nursing, health care
      • Resources
      • local revitalization

    Mr Watanabe introduced several industry-academia-government collaboration projects addressing these priority issues. The economic effects by 2020 of creating new industries stimulated by these government programs are estimated as follows:

    1. super-aging society sector: 23 trillion yen (US$ 230 billion)
    2. resource sector (minerals, water, food, infrastructure): 20 trillion yen (US$ 200 billion)
    3. geospace sector: 62 trillion yen (US$ 620 billion), from today’s 20 trillion yen (US$ 200 billion) market size

    A further program is the creation of ICT Smart Towns in Japan, especially also to build towns resilient against disasters.

    John Rossant: A people-centric vision for future cities

    Founder and Chairman of New Cities Foundation

    By 2050, around 70% of the world’s population is expected to reside in urban areas.

    Mobile applications transform cities, and in the ideal case create “people centric cities”, an example: AppMyCity!

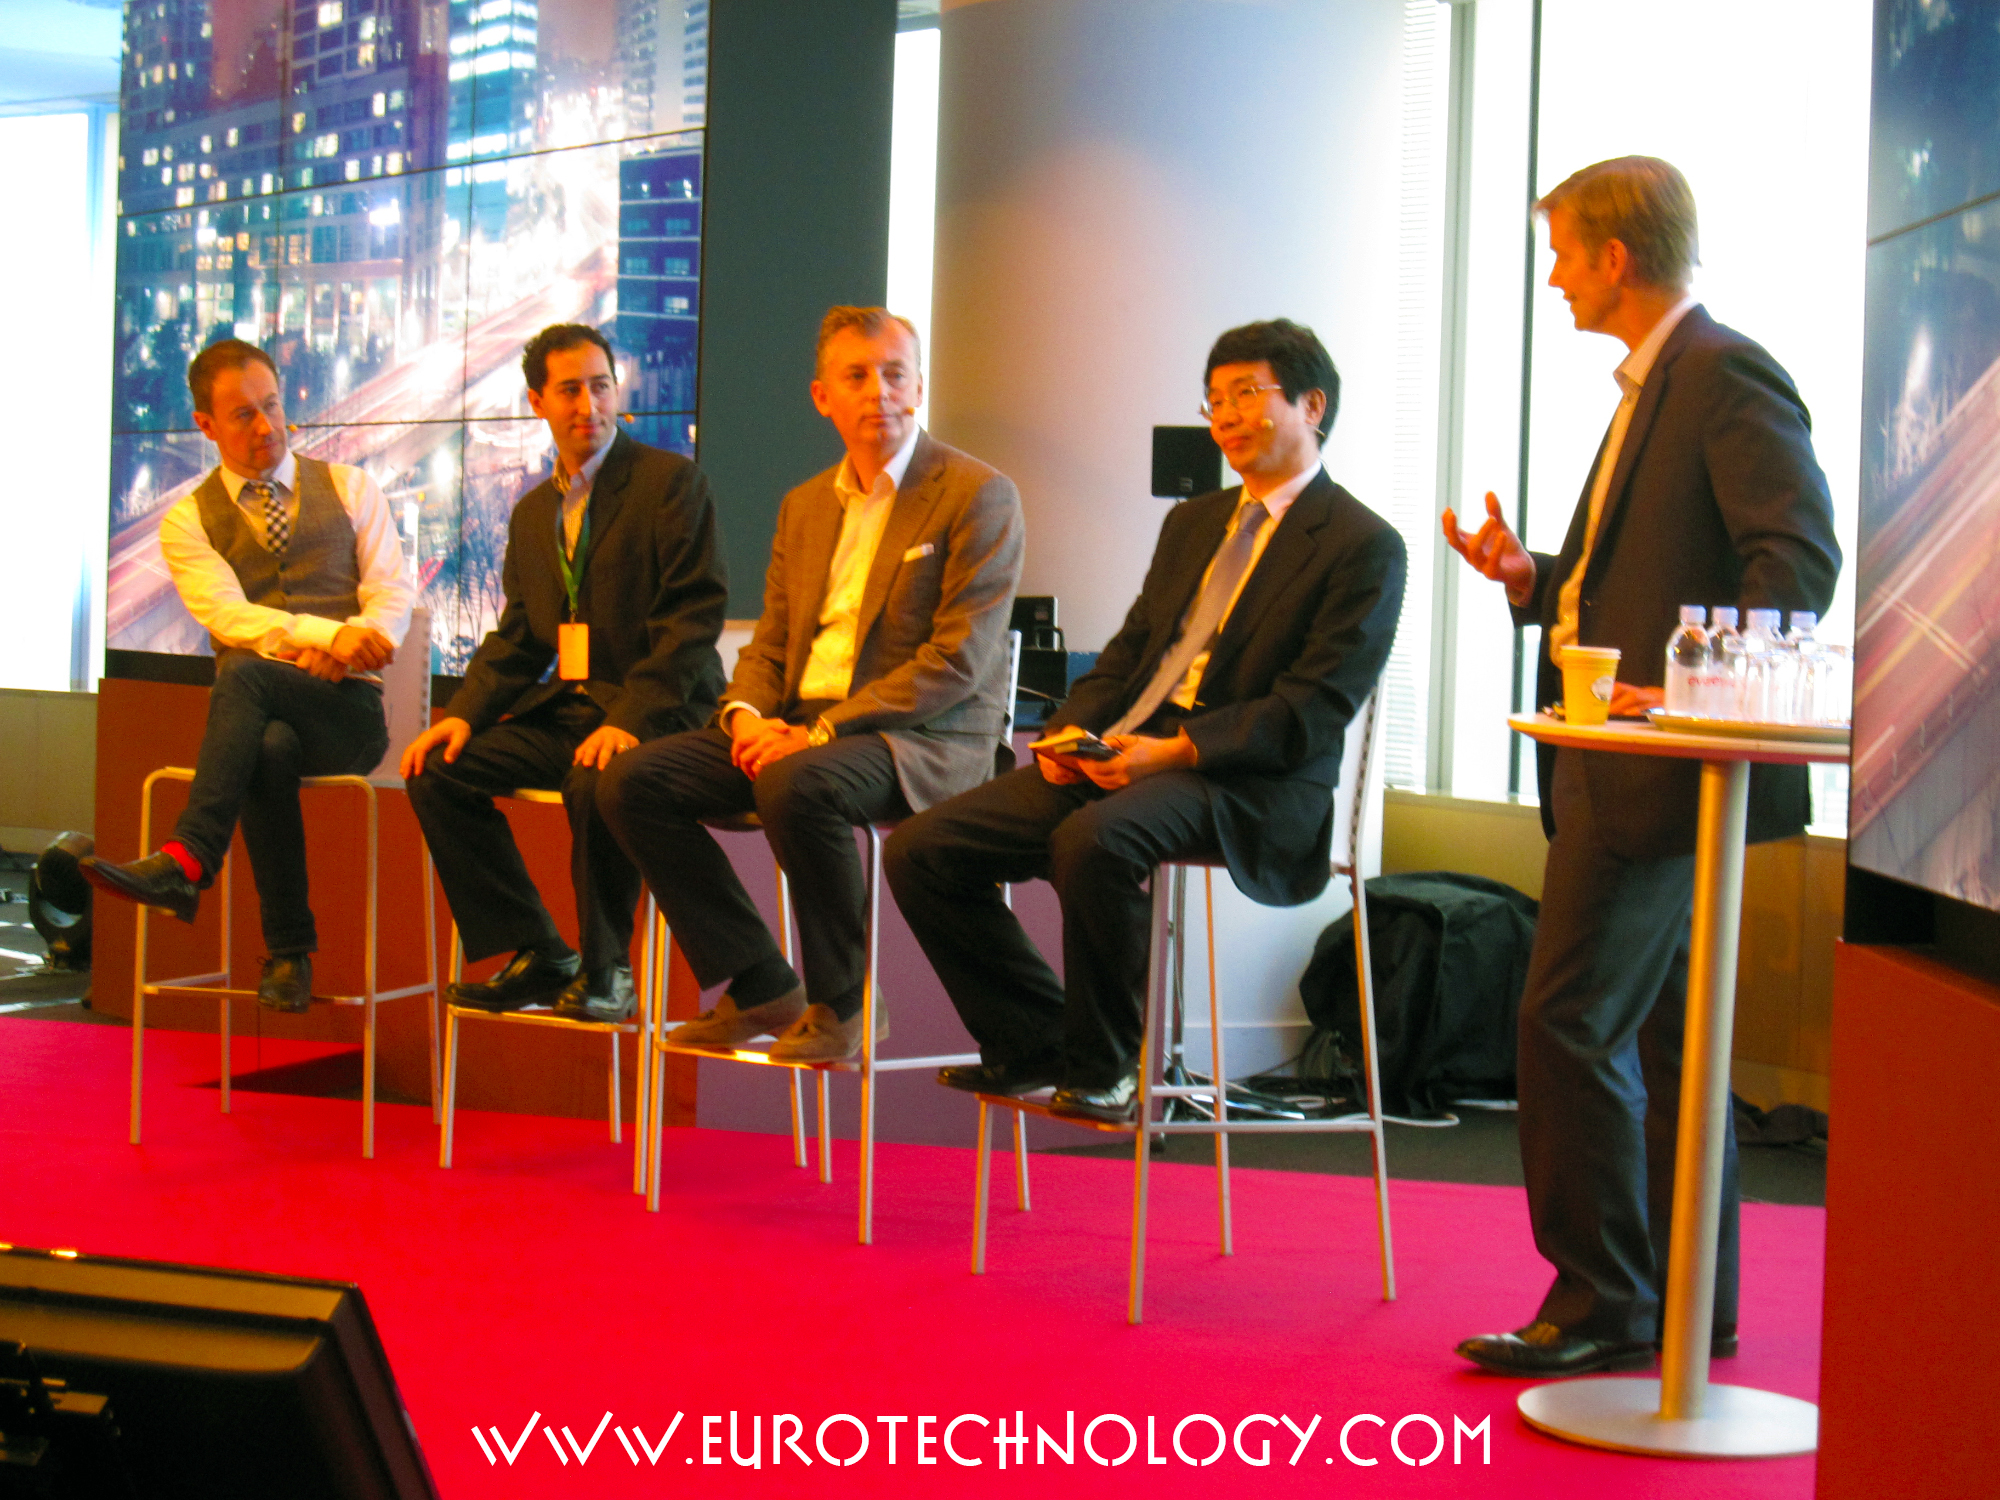
    Panel "Society in transformation"(left to right): Mats Olsson (Ericsson), Katsuya Watanabe (MIC), John Rossant (New Cities Foundation), Douglas Gilstrap (Ericsson)
    Panel “Society in transformation”(left to right): Mats Olsson (Ericsson), Katsuya Watanabe (MIC), John Rossant (New Cities Foundation), Douglas Gilstrap (Ericsson)

    Business in transformation

    Jan Signell, Head of North East Asia and member of Ericsson Global Leadership Team
    Jan Signell, Head of North East Asia and member of Ericsson Global Leadership Team

    Jan Signell: Ericsson in Japan, China, S-Korea

    Head of North East Asia Region, President of Ericsson-Japan

    The first Ericsson distributor travelled to Japan in 1894 – more than 100 years ago.

    Super high smartphone penetration and usage in Japan+China+S-Korea: Japan has 76% smartphone penetration, 49% of Chinese make purchases on their smartphone every week, networks have to be prepared.

    Hiroyasu Asami, Managing Director of Smart-Life Business Division, NTT-DOCOMO
    Hiroyasu Asami, Managing Director of Smart-Life Business Division, NTT-DOCOMO

    Hiroyasu Asami: “NTT-DOCOMO‘s smart-life partner initiative

    Managing Director of Smart-Life Business Division, NTT-DOCOMO

    NTT-DOCOMO aims to be the customer’s partner for smart-life.

    In the transition from traditional feature phones to smartphones including tablets, NTT-DOCOMO sees a new potential market emerging: video, shopping, books, services and contents are booming.

    The center of the mobile eco-system (and value creation) is shifting to higher layers.

    NTT-DOCOMO seeks effective utilization of its business assets:

    • Postpaid subscriptions (99.7% postpaid)
    • VAS sales at mobile shops: DOCOMO has 2,400 carrier DOCOMO branded shops
    • Handset control: DOCOMO sells handsets with value added services (VAS)

    DOCOMO seeks to create new markets in 8 business areas:

    1. Commerce
    2. Finance/payment
    3. Health care/education
    4. M2M
    5. Safety/security
    6. Environment/ecology
    7. Aggregation/platform
    8. Media/content

    The basic concept is to bring smart life into reality, and to become a smart life partner. To improve customer satisfaction and to improve corporate value.

    DOCOMO is in the process to transition from the traditional i-Mode and i-Menu services on feature phones, to d-market and d-menu for the multi-OS environment (with Google/Android, Tizen, iOS and other OS).

    Revenues from new business of DOCOMO increased from US$ 4 billion (FY2011), to US$ 6 billion (FY2012) and is expected to increase to US$ 11 billion by FY2015.

    Masashi Satomura, Chief Engineer Dept 3, Honda R&D
    Masashi Satomura, Chief Engineer Dept 3, Honda R&D

    Masashi Satomura: “ITS, Cooperative system”

    Chief Engineer Dept 3, Honda R&D

    About 300 parties participate in Japan’s ITS programs, lead by the ITS Promotion in the Cabinet office of Japan.

    Major cooperative projects are:

    • ASV-5 (V2V, V2P) by the Ministry for Land and Infrastructure and Transport MLIT
    • Joint research (V21) by MLIT and NILIM
    • DSSS/Green wave (V21) by the Nation Police Agency

    Key issues are:

    • Standardization
    • Common hardware
    • hybrid communication
    • sustainable business model
    • positioning technology

    Key targets are to achieve fatality rates below 2500 by 2018, and to reduce traffic congestions to one-half by 2020 compared to 2010.

    Honda develops autonomous driving with the aim to realize “the joy of mobility” with safety and freedom.

    The vision: As Japan aiming for the safest transportation in the world, we hope to deploy cooperation system in collaboration with government and car OEMs, in four phases.
    Phase 1: basic services
    Phase 2: advanced services
    Phase 3: integrated services
    Phase 4: autonomous services

    Panel (left to right): Akira Yamaguchi (Orient Corporation), Hiroyasu Asami (NTT-DOCOMO),Masashi Satomura (Honda), Jan Signell (Ericsson)(
    Panel (left to right): Akira Yamaguchi (Orient Corporation), Hiroyasu Asami (NTT-DOCOMO),Masashi Satomura (Honda), Jan Signell (Ericsson)(
    Ulf Ewaldsson, CTO, Ericsson
    Ulf Ewaldsson, CTO, Ericsson

    Ulf Ewaldsson

    CTO, Ericsson

    A perfect storm:

    • Network coverage and quality is good enough
    • Business models make data affordable
    • App-centric services become mainstream
    • Smartphone penetration is reaching critical mass

    however, for mobile operators there is a HUGE difference between the frontrunner’s revenue and EBITDA growth compared with stagnant revenue/EBITDA for average operators. Key for mobile operators is to be strongly growing frontrunner – not a stagnating average operator.

    To move from an average no-growth operator to a fast-growing frontrunner, a mindshift is needed from:

    • problem focus to opportunity focus
    • maximizing old revenues to innovating new revenues
    • connectivity as a commodity (“dumb pipe”) to connectivity as differentiator
    • from tech silos to tech synergies

    Ericsson uses six growth codes:

    1. “Streetwise metrics”, experience centric KPIs
    2. “Show casing”: quality led marketing
    3. Redefine subscription: “unboxing”
    4. Open-ended innovation: “ecosystematic
    5. Visionary collaboration: “co-partnering”
    6. Visionary investing: “gap minding”
    Yung-Ha Ji, Head of Network Strategy Dept., KT Corporation
    Yung-Ha Ji, Head of Network Strategy Dept., KT Corporation

    Yung-Ha Ji: How to migrate to future ICT network

    Head of Network Strategy Department, KT Corporation

    In the IDI/ICT Global Development index ranking, S-Korea ranks 1st globally for broadband, while the Scandinavian countries rank 2nd, 3rd, 4th and 5th, and Japan ranks 8th, followed by UK on place 9.

    kt will cover 99% of S-Korea’s population with LTE network based on 20MHz Bandwidth in the 1.8GHz band. With the BenchBee speed test, download speeds of 44 Mbps are achieved with a Category 4 LTE-A phone.

    kt saw explosive growth of data traffic: 350 times increase over the 4 years from January 2009 to September 2013.
    Monthly data usage is 2.2Gb for LTE and 1.2Gb for 3G phones. Total data traffic is about 20,000 TeraBit/Month in September 2013.

    kt has the world-first LTE network using virtualization cloud technology.

    kt introduced a series of services including Web-enabled IPTV, Giga-Internet FTTH premium services, olleh TV mobile, LTE broadcast, “Total Advertising Open Community” (TAOC) – using targeting of advertisements to differentiate from OTT operators.

    Example of an innovative service: if you click an advertisement and watch an ad, you are rewarded with increased transmission speed.

    Akira Yamaguchi: Mobile payment systems in Japan

    Exec Officer Retail finance and credit cards, Orient Corporation

    Jakob Navok, Director of Business Development, Square Enix
    Jakob Navok, Director of Business Development, Square Enix

    Jacob Navok: Games over the network

    Director of Business Development, Square-Enix

    Games are the ultimate application! Worldwide game industry revenues are US$77.4 billion in 2013, adding all segments from retail hardware to software and services.

    Hardware used to be the driver in the past, but today the network drives everything, and networks bring disruption to game design, business models (“free-to-play” is a marketing model – not a business model). Business models include: micro transactions, subscriptions, advertisements and digital pricing.

    Marketing disruption include: “free-to-play”, cross-promotional networks, and app-stores.

    Video had a dramatic impact on networks, but games have not.

    Interactive media bring the next revolution: SONY acquired Gaikai (US$ 400 million), and Microsoft announced Xbox Cloud services (US$ 700 million).

    Server side rendering and developer innovation will create game demand on many devices.

    Speed is key!

    Dan Simmons, Reporter and Producer, CLICK, BBC
    Dan Simmons, Reporter and Producer, CLICK, BBC

    Dan Simmons

    Reporter and Producer, CLICK, BBC

    Dan Simmons showed how smart phones are a second screen accompanying movies, PCs and TV. 60-80% of Americans use a second screen, and 46% use a smart phone.

    Eyeballs move to iPads… the question is: who owns the second screen!

    CBS made US$ 10 million off advertising, but advertising ads during superball on the internet – not on TV!

    TV is about raising emotions, and feedback at the moment, immediate feedback is incredibly valuable. A 2nd screen can give a 360 degrees view.

    Dan mentioned the APP-movie, where visitors to the movie theatre downloaded an App to their smartphone and received message to their App during the movie. The messages need to be frame-accurate, and today’s networks are not good enough to ensure frame-accuracy. People with smartphones and using the App knew who the murderer was at 65 minutes into the movie, while visitors without smartphone and App had to wait until 80 minutes into the movie before they know who the murderer was. Initially it was thought that this could be a problem, but it turned out to be a positive part of the enjoyment for the audience. A further attraction was, that visitors could keep the App on their smartphone, and the movie owner could reach viewers long after the performance was over, and they had long left the movie theatre, keep the contact, and potentially create follow-on business.

    Panel (left to right): Dan Simmons (BBC), Jacob Navok (Square-Enix), Ulf Ewaldsson (Ericsson), Yung-Ha Ji (KT Corporation)
    Panel (left to right): Dan Simmons (BBC), Jacob Navok (Square-Enix), Ulf Ewaldsson (Ericsson), Yung-Ha Ji (KT Corporation)
    Adrian Ionel, CEO, Mirantis
    Adrian Ionel, CEO, Mirantis

    Shoji Nemoto

    Exec VP, SONY Corporation

    Q&A

    Question: SONY identity in 2020?

    Shoji Nemoto: Our mission is to fulfill & inspire the desires of users

    Question: 3D-TV failed. How can we know that 4k-TV will be successful?

    Shoji Nemoto: 3D is not only a consumer product. 4k-TV also has industrial applications, such as telemedicine and other medical applications. SONY cooperates with Olympus for medical applications.

    Adrian Ionel

    CEO, Mirantis

    Today for every new product you need a network and a data center:

    • SIRI: Apple invested US$ 1 billion in a data center
    • X-BOX: Microsoft built a data center

    Open source is extremely powerful vs closed systems:

    1. opensource is created by users, users are involved from the beginning and users are extremely powerful
    2. Open: anybody can contribute
    3. Closed source vs open source:
      • closed source: traditional hierarchical industrial structure, waterfall model, top-down
      • open source: works like nature, social network, meritocracy and transparency, very different to traditional industrial structure

    Examples for open source: Linux, JAVA, Big data.

    Open source creates new business models. Facebook, Google, Amazon.com are only possible with open source. Gigantic data centers are only possible with open source.

    Most major players invest in open source.

    Taro Kodama, Country Growth Manager, Facebook Japan
    Taro Kodama, Country Growth Manager, Facebook Japan

    Taro Kodama

    Country Growth Manager, Facebook Japan

    No. 1 Facebook employee in Japan.

    “We can’t just copy what we did in Japan – we must reinvent in Japan”

    • Facebook’s complacency about mobile is surprising. Its this kind of complacency that kills companies (Forbes.com, February 2012)
    • Facebook’s future is in mobile. Mobile is THE strategy for Facebook (Forbes.com, May 2013)

    Facebook: over 874 million users on mobile, 49% of revenue is now generated from mobile, up from 0% last year.

    • Connect everyone
    • Understand the world
    • Build the knowledge economy

    Facebook opportunity:
    Facebook: 1.1 billion users
    Online: 2.4 billion
    World population: 7 billion

    Internet traffic is shifting to mobile: 13% of global internet traffic is on mobile.

    Panel (left to right): Ulf Ewaldsson (Ericsson), Adrian Ionel (Mirantis), Taro Kodama (Facebook)
    Panel (left to right): Ulf Ewaldsson (Ericsson), Adrian Ionel (Mirantis), Taro Kodama (Facebook)

    Innovation and technology evolution

    Ulf Ewaldsson, CTO, Ericsson
    Ulf Ewaldsson, CTO, Ericsson

    Ulf Ewaldsson: “Transforming networks

    CTO, Ericsson

    We see cities as organisms.

    Trendspotting:

    • scarce spectrum
    • simplicity and automation
    • continued traffic growth
    • from nodes to systems
    • mobile entreprise
    • blurring of IT and telecom

    Concept of “Network slices”:

    Network performance needs depend on industry, beyond just smartphones.

    A matrix of industry needs covering the following industries: cars, processing, utilities, transport, media, and NSPS, healthcare etc.
    Which have different needs for: throughput, latency, QoS, volumes, coverage, capacity, security and location.

    A common network platform includes dynamic and secure “network slices” with different specifications for different industries and applications.

    Three new products:

    • Ericsson Radio Dot System
    • SDN on a chip: SNP 4000
    • Cloud on a blade: Ericsson Cloud System

    Technology in-depth sessions

    Erik Ekudden, Head of Technology Strategies, Ericsson
    Erik Ekudden, Head of Technology Strategies, Ericsson

    Network Slices: Service Provider (SP) Software Defined Networks (SDN), Network Functions Virtualization (NFV) and Cloud

    Erik Ekudden

    Head of Technology Strategies, Ericsson

    Service Provider based Software Defined Networks (SP SDN) are on the way to deployment. The path to deployment includes: technology, business model development and operations. Currently we are still midway in the technology development phase, business model development is in the early phase, and we are just before operations and deployment.

    Network functions are virtualized in the DC/cloud infrastructure. Functional layers of the network are virtualized, and networks become open to developers.

    Networks are elastic and we have “network slices” for different applications.

    OpenDayLight

    Ericsson is leading participant/founder in the open source “OpenDaylight” LINUX community, the first release of the Hydrogen Code was on September 13, 2013. OpenDayLight is an open source community developing software-defined networking (SDN).

    Daniel Ehrenstrahle, Head of Strategy & Portfolio, BU Networks, Ericsson
    Daniel Ehrenstrahle, Head of Strategy & Portfolio, BU Networks, Ericsson

    Connecting the dots in the Networked Society

    Daniel Ehrenstrahle

    Head of Strategy & Portfolio, BU Networks, Ericsson

    Business cases and clear rationale why technology is introduced is necessary.

    We need to redefine how network performance is defined: “app coverage” defines network performance not in terms of technical data alone, but in terms of usability of each app. App coverage for video will be different than for voice, or low intensity data applications.

    70% of usage is indoors, therefore we need indoor coverage, and Ericsson does not believe in Femto-technology, and introduces the Radio Dot System. Launch will be in 2H 2014 for 3G and 4G and for WiFi later. Up to 4 channels per unit.

    Component based architecture:
    AIR = antenna integrated unit
    SSR = Edge router

    Ericsson "DOT"
    Ericsson “DOT”
    Ericsson Radio "DOT" System: RJ45 Antenna Mounting Unit and Active Antenna Element taken apart
    Ericsson Radio “DOT” System: RJ45 Antenna Mounting Unit and Active Antenna Element taken apart
    Ericsson "DOT" system, RJ45 connector socket
    Ericsson “DOT” system, RJ45 connector socket

    Monetizing the network assets

    Beau Atwater

    Head of Strategy and Business Intelligence, BU Support Solutions, Ericsson

    Tomas Ageskog, Head of Consulting and Systems Integration, BU Global Services, Ericsson
    Tomas Ageskog, Head of Consulting and Systems Integration, BU Global Services, Ericsson

    Business Transformation – Ericsson Consulting and System Integration (SI)

    Tomas Ageskog

    Head of SI Core, IP & Media, Ericsson

    Manufacturing and other industries have rationalized decades ago. Telcos are not yet rationalized.

    OSS/BSS need to be good and fast to make money.

    A revolution will happen in the broadcast space when processes are being rationalized.

    In Australia, Telstra spent US$ 1.1 billion for a billing system.

    As another example, a Tier-1 European telco operator had 62 different billing systems.

    Challenges:

    • Business agility,
    • time to market,
    • from network centric to customer centric,
    • Next generation networks, mobile broadband and cloud computing
    • Roles in new business models and eco-systems

    Ericsson Global Services division grew from SEK 29 billion and 8000 people in 2003 to SEK 97 billion and 60,000 people in 2012.

    Copyright (c) 2013 Eurotechnology Japan KK All Rights Reserved

  • “Japanese superman Masayoshi Son” invests in Supercell (interview for Talouselämä, Finland’s largest business newspaper)

    “Japanese superman Masayoshi Son” invests in Supercell (interview for Talouselämä, Finland’s largest business newspaper)

    “Japanese superman Masayoshi Son” invests in SuperCell – interview with Finland’s largest business newspaper Talouselämä

    Talouselämä (Finland’s largest business newspaper)’s news editor Mirva Heiskanen interviewed me for their article entitled “Japanese superman Masayoshi Son invests in Supercell” (Supercellin ostaja Masayoshi Son on Japanin supermies).

    More interviews by Gerhard Fasol.
    To understand SoftBank better, read our report on SoftBank, an analysis of SoftBank, history, current data, and the context.

    Here are some of my main points:

    Its not well known in Europe and US yet, but SoftBank is a very large company, and aiming to become the world’s largest company

    SoftBank is really a very large company, driven by the charismatic founder Masayoshi Son. To get a feeling for the size of SoftBank, while the investment in Supercell is a large amount of money by anybody’s standards, its about 5% of SoftBank’s acquisitions this year alone (in addition to M&A type investments, SoftBank also invests substantial sums in networking equipment and other telecom business infrastructure and data centers).

    SoftBank invested in about 1500 companies, the most famous currently being Alibaba

    Overall SoftBank invests in about 1500 companies or more: SoftBank takes a venture capital approach to this portfolio. Overall SoftBank investments are incredibly successful. As an example, look at the currently important Alibaba case:
    Softbank acquired 36.7% of Alibaba in 2000 for US$ 20 million.
    Alibaba’s market cap will be determined after its IPO, but currently figures between US$ 100 billion and even up to US$ 250 billion circulate. This would value SoftBank’s 36.7% stake in Alibaba at somewhere between US$ 36.7 billion and US$ 91 billion, a return on initial investment between 1835 and 4550 times!

    While SoftBank’s overall portfolio is outstandingly successful, not every single investment is successful, as is normal for a venture type investment style.

    This year alone, SoftBank investments and acquisitions amount to about US$ 30 billion

    This year SoftBank’s direct investments and acquisitions alone are on the order of US$ 30 billion and include:

    • Sprint US$ 21.6 billion + infrastructure investments
    • Clearwire (not sure if this is included in the Sprint figures)
    • eMobile/eAccess US$ 5 billion including debt
    • GungHo increase stake US$ 1/4 billion
    • Supercell US$ 1.5 billion
    • mobile phone distributor Brightstar which is another US$ 1.26 billion

    Talouselämä questions about SoftBank and its investment in Supercell and my answers:

    • What are SoftBank’s targets? SoftBank wants to become one of the most important companies globally, has a 30 year plan and a 300 your plan
    • How does SoftBank integrate acquisitions? Case-by-case. In some cases, e.g. Vodafone-Japan KK, Softbank totally absorbed the company and its assets became much of the starting point of SoftBank Mobile, however today’s SoftBank Mobile is a dramatically different company compared to Vodafone-Japan KK, which according to Masayoshi Son in recent interviews “was going south”.
    • How important are games for Softbank? SoftBank is major investor in GungHo, which is one of the world’s most successful smartphone game companies.
    • What other businesses does SoftBank concentrate on, and what kind of goals does it have? SoftBank today focusses on mobile communications and internet, however is also active in other areas. For example, SoftBank is aggressively building an energy business, with focus on renewable energy, which includes renewable energy investments in Mongolia for example. SoftBank‘s more than 1500 investments include Alibaba and Yahoo Japan KK.

    To understand SoftBank better, read our report on SoftBank, an analysis of SoftBank, history, current data, and the context.

    Understand Japan’s games sector and its disruption

    Report “Japan game makers and markets” (pdf file, approx 400 pages, 140 figures)

    Copyright (c) 2013 Eurotechnology Japan KK All Rights Reserved

  • Supercell wins SoftBank and GungHo investment

    Supercell wins SoftBank and GungHo investment

    Supercell investment by SoftBank and GungHo

    Supercell investment leverages paradigm shift, time shift and market disconnects

    Smartphones and the “freemium” business models are bringing a dual paradigm shift to games and create a new truly global market. To take advantage of this global paradigm shift, its necessary to overcome the cultural disconnects between markets. SoftBank and GungHo‘s investment in the Finnish smartphone/tablet game maker Supercell, announced on Oct. 15, will help to overcome the disconnect between Japan’s and other game markets for both Supercell and GungHo.

    The disconnect between Japan and other countries is often surprising – when BusinessWeek in 2006 commented on rumors that SoftBank might introduce an Apple “iPod-Phone” to Japan, BusinessWeek remarked that “Apple would normally never talk to a small-fry such as SoftBank” …. at that time SoftBank’s annual revenues were about twice Apple’s, and BusinessWeek printed my correction pointing out that SoftBank even at that time was anything but a “small fry”.

    One of SoftBank‘s aspects is it’s “time-shift” investment model, another is SoftBank‘s 30/300 year vision – both are important factors to understand the Supercell investment.

    Comparing Supercell's US$ 3 billion valuation with Japanese game companies (note that the market cap for the full SONY Group is shown here)
    Comparing Supercell’s US$ 3 billion valuation with Japanese game companies (note that the market cap for the full SONY Group is shown here)

    This Figure contrasts the market caps of new mobile and smartphone centric game companies (GungHo, Supercell, DeNA and GREE) with traditional console, video game and arcade game companies.

    SoftBank announced that because of the majority investment, Supercell will become a subsidiary of SoftBank, and GungHo will account for Supercell’s profit/loss under the equity method.

    Comparing Supercell's US$ 3 billion valuation with Japanese game companies (note that the market cap for the full SONY Group is shown here) and SoftBank
    Comparing Supercell’s US$ 3 billion valuation with Japanese game companies (note that the market cap for the full SONY Group is shown here) and SoftBank

    GungHo and Supercell both are top-ranking mobile game companies: GungHo inside Japan with “Puzzle and Dragons”, and Supercell outside Japan with “Hay Day” and “Clash of Clans”. Expect both to leverage each other’s resources.

    Both GungHo and Supercell show explosive growth:
    GungHo’s operating profits increased 4050% (x 40) for Jan-June 2013 compared to the same period one year earlier.
    Supercell’s revenues (mainly in-game purchases) jumped 500x from EURO 151,000 in 2011 to EURO 78 million in 2012.

    Culture can be an issue between Japan and other countries, however, SoftBank has invested in more than 1000 comparable companies, and many of SoftBank’s investments have been outstandingly successful including Alibaba and Yahoo.

    However, investment and management support by SoftBank does not automatically guarantee success in Japan – despite SoftBank’s investment and support, Zynga closed operations in Japan earlier this year. Success in Japan will remain Supercell’s responsibility, despite SoftBank’s and GungHo’s help and investment – as Zynga can tell.

    SoftBank aims for global No. 1 position: Learn more about SoftBank, Masayoshi Son, and his 30/300 year vision for SoftBank

    Report on “SoftBank today and 300 year vision” (approx 120 page, pdf file)

    Copyright (c) 2013 Eurotechnology Japan KK All Rights Reserved

  • Japan game market disruption: GungHo + DeNA + GREE overtake Japan’s game icons

    Japan game market disruption: GungHo + DeNA + GREE overtake Japan’s game icons

    Japan game market disruption: new smartphone game companies overtake Japan’s game icons like Nintendo in income

    [日本語版はこちらへ]

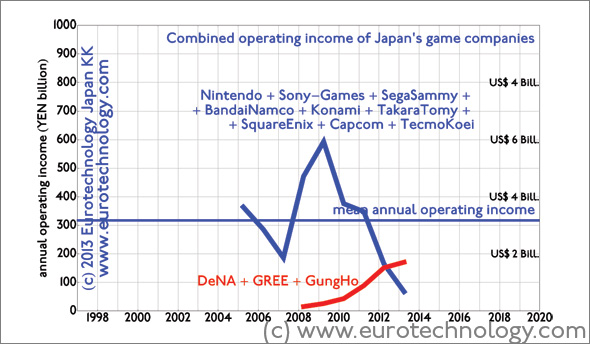
    Since last financial year (ended March 31, 2013), three newcomers (GungHo, DeNA, and GREE) combined achieved higher operating income and higher net income than all 9 iconic Japanese game companies (Nintendo + SONY-Games + SegaSammy + BandaiNamco + Konami + TakaraTomy + SquareEnix + Capcom + TecmoKoei) combined.

    While the newcomer’s revenues are increasing (except for GREE), the traditional 9 game companies’ revenues peaked in 2008, and have been falling rapidly ever since.

    Clearly Japan’s the 2003-2005 mergers in Japan’s game sector did not make the sector “future proof” – more dramatic changes will be either initiated by the iconic incumbents, or imposed on them from newcomers such as GungHo.

    Note that the position of foreign entrants remain weak in Japan’s game market overall.

    Read more in the article below or in our report on “Japan’s game makers and markets”, and in the following post “Brutal disruption of Japan’s Game Markets”.

    Three new game companies (GungHo, DeNA, GREE) overtake Japan's 9 iconic game companies in operating profits (note that the last data point for 2013 for GungHo is only for the first 6 months, i.e. full year results will show that the "new" game companies are doing even better compared to the "old" game companies than visible in this figure) Source: https://www.eurotechnology.com/store/jgames/
    Three new game companies (GungHo, DeNA, GREE) overtake Japan’s 9 iconic game companies in operating profits (note that the last data point for 2013 for GungHo is only for the first 6 months, i.e. full year results will show that the “new” game companies are doing even better compared to the “old” game companies than visible in this figure) Source: https://www.eurotechnology.com/store/jgames/
    Three newcomers (GungHo, DeNA, GREE) achieve higher net profits than all 9 Japanese game icons combined (note that the last data point for 2013 for GungHo is only for the first 6 months, i.e. full year results will show that the "new" game companies are doing even better compared to the "old" game companies than visible in this figure) source: https://www.eurotechnology.com/store/jgames/
    Three newcomers (GungHo, DeNA, GREE) achieve higher net profits than all 9 Japanese game icons combined (note that the last data point for 2013 for GungHo is only for the first 6 months, i.e. full year results will show that the “new” game companies are doing even better compared to the “old” game companies than visible in this figure) source: https://www.eurotechnology.com/store/jgames/

    Japan game market disruption: online and smartphone came company GungHo with Puzzle and Dragons

    GungHo started as OnSale KK, a joint-venture between SoftBank and the US company OnSale Inc., the purpose of this JV was Japan market entry for this US company, an ecommerce company.
    OnSale KK pivoted from ecommerce to games and started to distribute the Korean game Ragnarok and others, and changed its name to GungHo.
    GungHo’s breakthrough came with “Puzzle and Dragons” – Jan-June 2013 operating profits increased 4050.1% (four thousand fifty percent) compared to the same period one year ago. GungHo is part of the SoftBank group.
    More in our report on “Japan’s game makers and markets”

    Japan game market disruption: GREE

    GREE on the other hand – although a successful new venture in Japan’s game sector – is not doing so well currently: reported revenues and income have both been falling. Essentially, GREE has difficulties to implement the plan to build a global business based on their Japanese methods and business models. The factors are both “hard” and “soft”, i.e. business models, and human factors.
    Details on GREE’s performance, and reasons for GREE’s current issues in our report:

    Copyright 2013 Eurotechnology Japan KK All Rights Reserved

  • Japan game sector disruption

    Japan game sector disruption

    Japan’s iconic game companies (Nintendo, Sony, Sega-Sammy, Bandai-Namco, Konami, Takara-Tomy, Square-Enix, Capcom, Tecmo-Koei) see brutal disruption by smart phone games

    Japan game sector disruption: Three newcomers (GREE, DeNA and GungHo) achieve higher operating income than all top 9 incumbent game companies combined

    Japan’s top 9 iconic game companies, Nintendo, Sony, Sega-Sammy, Bandai-Namco, Konami, Takara-Tomy, Square-Enix, Capcom, Tecmo-Koei created much of the world’s games markets, and many of the world’s most loved game characters.

    They are now seeing brutal disruption.

    Japan game sector disruption

    With the Financial Year ending March 31, 2013, for the first time, just three Japanese newcomers (GREE, DeNA and GungHo) achieved higher operating income than all top 9 Japanese iconic incumbent game makers:

    In FY2012 combined operating income of all 9 incumbent game companies was YEN 67.6 billion (US$ 700 million), combined operating income of the 3 newcomers was YEN 174 billion (US$ 1.8 billion) – even though for GungHo only the first 6 months of 2013 are included in the calculation.

    Operating income of Japan's top 9 games companies declined steadily since 2009 - combined operating income for FY2012 was YEN 67.6 billion (US$ 700 million)
    Operating income of Japan’s top 9 games companies declined steadily since 2009 – combined operating income for FY2012 was YEN 67.6 billion (US$ 700 million)
    In 2013, three newcomers (GREE, DeNA, GungHo) achieved higher operating income than all nine established Japanese game makers. Combined operating income for FY2012 was YEN 174 billion (US$ 1.8 billion) 
    In 2013, three newcomers (GREE, DeNA, GungHo) achieved higher operating income than all nine established Japanese game makers. Combined operating income for FY2012 was YEN 174 billion (US$ 1.8 billion) 

    The incumbents: Nintendo, Sony, Sega-Sammy, Bandai-Namco, Konami, Takara-Tomy, Square-Enix, Capcom, Tecmo-Koei

    Because of its size, Nintendo has the greatest weight in the overall performance of Japan’s traditional game sector. Nintendo has been dramatically affected by the shift from traditional game consoles to smartphones. Still, Nintendo (as all other Japanese iconic game companies) has tremendous resources, tremendous creativity, globally loved characters and brands, and huge cash reserves. I don’t think that Nintendo (and other Japanese game companies) risk as much to follow Nokia and RIM/BlackBerry’s fate, but may be more resilient. However, there has been substantial consolidation in Japan’s games sector of recent years, and the current challenges could lead to more M&A in Japan’s games sector.

    The disruptors

    We have only picked three important new market entrants – there are many more in Japan’s vibrant mobile game venture scene.

    DeNA

    DeNA initially started as a mobile auction group, and sees continuous strong growth and high margins.

    GREE

    Of these three, GREE is currently suffering some set-backs originating from GREE’s business model. GREE started as a SNS and social game platform on Japan’s “galake” (Galapagos Keitai) relying on Japan’s mobile internet services i-Mode, EZweb and Yahoo-Mobile, where operators traditionally take 9% commissions. Initially GREE tried to transfer this “platform on platform” business model to other countries, but this does not seem to work out. So GREE is now pivoting to original games, and has seen setbacks.

    GungHo

    GungHo started as a joint-venture with a US company, the purpose of this JV was Japan market entry for this US company. GungHo then pivoted away from this joint-venture to become a games company, and produced a series of games, which all did well, but not extraordinarily well. That is, until GungHo created “Puzzle and Dragons”, which is growing spectacularly well: Jan-June 2013 operating profits increased 4050.1% (four thousand fifty percent) compared to the same period one year ago, and net profits increased 2507.8% (two thousand seven percent) compared to Jan-June one year ago.

    The disruption

    The shift to smartphones is hitting Japanese traditional iconic game makers from all sides:

    • the shift from TV to tablets and mobile phones
    • the shift from dedicated game consoles to smart phones and tablets
    • the shift from Japan’s “galake” feature phones to smart phones
    • the shift in business model from traditional US$ 40-60 game cassettes-type to free game downloads with in-game purchases and advertising
    • …and more

    Japan’s game sector report

    Learn more: read our report on Japan’s game makers and markets
    (approx. 400 pages, pdf file)

    Copyright (c) 2013 Eurotechnology Japan KK All Rights Reserved

  • Future of Video Game Sector (CNBC Airtime: Thurs. Jul. 30 2009)

    Future of Video Game Sector (CNBC Airtime: Thurs. Jul. 30 2009)

    Read more about Nintendo and the games sector: http://www.eurotechnology.com/store/jgames/

    Read more about Japan’s electrical industry sector in our Japan’s electronics industry report (pdf file)

    Subscribe to our newsletters:
    technology newsletters from Japan

  • Do mobile app-stores and online games disrupt Nintendo’s blue ocean?

    Japan introduced the mobile internet with i-Mode in 1999, while i-Phone and friends are now getting the rest of the world hooked onto the mobile internet.

    Games used to be played in game parlors, and some of Japan’s game giants were originally and still are game parlor machine makers – a round of Dance-Dance-Revolution anyone? Next came consoles, cassettes and handhelds, taking the growth momentum out of game parlors, and establishing a pattern of growth by generations (today we are in the 7th Generation). Nintendo broke the cozy generation pattern where pixels and MHz increased in predictable ways from Generation to Generation without much other fundamental change. Nintendo took games sideways into the blue oceans of motion sensors and to the silver generation, women and other previously non-gaming majorities, while Xbox and SONY kept slugging out the generation game.

    We have been analyzing the Tokyo Game Show for many years – at the 2004 Tokyo Game Show, when SONY gave previews of the PSP – actually, I was personally much more interested in DoCoMo’s huge exhibition village setting a stage for about 15 mobile phone gaming partners.

    Since i-Mode started mobile phone games in 1999, online and mobile phone games combined have essentially outgrown the video game software sector in 2009, and are certain to grow much more in coming years – the iPhone is not slowing mobile phone based gaming down…. Those who only count video game cassettes and consoles, certainly don’t see the rapid mobile and online growth – and complain about shrinking markets.

    Is Nintendo now being blind-sided by mobile phones and app-stores?

    I don’t think so: not blind-sided – but strongly affected. Actually, Nintendo’s CEO and games developer Shigeru Miyamoto tell us they want to make their DSi’s central to everybody’s lives – with built in cameras, payments, app-stores, navigation. Essentially everyone on planet earth has a mobile phone, or will soon have one, or two. Many of todays phones in people’s hands can’t yet play games nicely – but DoCoMo’s phones do – and iPhones do also. Thats why we already see a lot of mobile gaming in Japan. Imagine the day when most mobile phones on planet earth can play games nicely? Will that day come?

    Will people upgrade to a DSi? or to a PSP? or to a better mobile phone? Apple and DoCoMo are both proof that people do pay for downloading games from i-Mode or i-Tunes app-stores – and that’s exactly the growth we see in the Figure – you don’t see that growth if you count only the number of game cassettes and consoles sold. In any case we may not see an 8th generation console – people might upgrade their phones instead – or use Skype on their PSP.

    Segmentation of Japan's games software industry
    Segmentation of Japan’s games software industry

    Copyright 2013 Eurotechnology Japan KK All Rights Reserved

  • Japan’s games sector overtakes electrical sector in income

    Japan’s games sector overtakes electrical sector in income

    Japan’s games sector is booming – and net annual income of Japan’s top 9 game companies combined has now overtaken the combined net income of all Japan’s top 19 electronics giants (including Hitachi, Panasonic, SONY, Fujitsu, Toshiba, SHARP… at the top, and ROHM, Omron… further down the ranking list).

    Why does it make sense to compare electronics giants with game companies? In many areas, especially home electronics and personal portable devices these two sectors compete for exactly the same consumer spending budgets and mind share.

    Pressure on Japan’s electrical giants for much more fundamental restructuring is increasing. More details below and find our calculations and analysis explained in our reports: Report on Japan’s electrical industry sector and our Report on Japan’s game industries.

    Figure compares the added total net income of Japan’s top 18 electrical companies (Hitachi, Panasonic, SONY…) with the combined total net income of Japan’s top 9 games companies (Nintendo, Bandai Namco…, not including SONY Computer Entertainment, because net income is not available).

    The games sector – lead by Nintendo – shows stable net income all through the current crisis years. While pressure on the electrical giants for more fundamental restructuring is increasing.

    -Money as a percentage of total money in Japan
    -Money as a percentage of total money in Japan

    Combined total net annual income of Japan’s games sector. (SONY Computer Entertainment is not included, since net income is not available)

    Combined annual income of Japan's top game companies
    Combined annual income of Japan’s top game companies

    Detailed analysis in our report on Japan’s games sector.

    Copyright (c) 2013 Eurotechnology Japan KK All Rights Reserved

  • Sanrio licenses "Hello Kitty" to Diseno Textil SA (ZARA)

    Diseno Textile SA (ZARA) entered Japan’s market earlier than H&M and can now collect some fruits from timing advantage: Diseno succeeded to obtain a license for Sanrio’s Hello Kitty character, and plans to market Hello Kitty branded goods.

    Will be interesting to see if H&M will do quid-pro-quo and seek to license other famous Japanese characters?

    Copyright (c) 2013 Eurotechnology Japan KK·All Rights Reserved

  • Nintendo’s CEO Satoru Iwata and Games Developer Superstar Shigeru Miyamoto

    Nintendo’s CEO Satoru Iwata and Games Developer Superstar Shigeru Miyamoto

    Nintendo’s CEO Satoru Iwata and games developer superstar Shigeru Miyamoto presented in Tokyo on April 9, 2009 about Nintendo’s situation and future plans.

    Iwata emphasized plans to move from one DS per household to one DS per person, by personalizing the DS, and by seeing that DS enriches everyday life. As examples he mentioned applications in hospitals and schools (which provoked a question from the audience what he plans to do about children who’s parents cannot afford to purchase a DS for their children), and in museums, where explanations on exhibits are given via the DS.

    Nintendo plans a “My DS” experience, by including two cameras in the new DSi, and with online downloads of small non-cartridge games and other applications from a new online store to enrich owners’ daily lives.

    Asked about Nintendo’s plans for the recession, Iwata answered, that key is to keep Nintendo’s products at the top of consumers’ wish lists.

    Read more about this presentation and analysis of Nintendo and Japan’s games sector in our J-GAMES report.

    Asked how Iwata plans to respond to the success of mobile phones, iMode and Appli games, and whether Nintendo plans to create own mobile phones or add phone functions to DS, Iwata explained his thinking under which conditions he would consider entering the mobile phone space.

    Nintendo's CEO Satoru Iwata and Games Developer Superstar Shigeru Miyamoto
    Nintendo’s CEO Satoru Iwata and Games Developer Superstar Shigeru Miyamoto
    Nintendo CEO Satoru Iwata speaks with passion
    Nintendo CEO Satoru Iwata speaks with passion

    Copyright (c) 2013 Eurotechnology Japan KK All Rights Reserved

  • Apple Nintendo Sony: The power of focus

    Apple Nintendo Sony: The power of focus

    Lets benchmark three iconic companies:

    Apple Nintendo Sony

    Apple Nintendo Sony: three iconic companies evolving along very different paths. Apple’s current physical products famously all fit onto a single mid-sized table. Nintendo’s current physical products as well, for SONY you’d need a warehouse.

    • APPLE: Wednesday October 22 APPLE announced spectacular full-year results with a year-on-year net income increase of 38%. The results are even better than they look, because iPhone sales and income are spread forward over 2 years due to accounting rules. (See our comments on CNBC here)
    • NINTENDO: on August 29, 2008 Nintendo revised the forecast for full-year net income upward by +26.2% (See our comments on CNBC here)
    • SONY: in contrast, on October 23, 2008, SONY said that full-year net income (for the financial year ending March 2009) is expected to be 37.5% lower than previously predicted (see our comments on SONY’s 1Q results here on CNBC)

    Apple Nintendo Sony – Lets look at today’s market caps:

    • APPLE market cap = US$ 85.6 Billion (about 4 x SONY)
    • NINTENDO market cap = US$ 37.2 Billion (about 2 x SONY)
    • SONY market cap = US$ 19.9 Billion

    Apple Nintendo Sony – Why this dramatic difference in market caps? We believe its focus.

    Apple and Nintendo are companies with clear focus. Lets look at the details below:

    Comparing revenues (sales):

    SONY = 3 x APPLE
    SONY = 4 x NINTENDO

    Annual revenues of Apple, Nintendo and SONY
    Annual revenues of Apple, Nintendo and SONY

    Comparing annual operating income:

    APPLE = 3 x SONY
    NINTENDO = 3 x SONY

    Operating income of Apple, Nintendo and SONY
    Operating income of Apple, Nintendo and SONY

    Comparing operating margin:

    APPLE = 9 x SONY
    NINTENDO = 15 x SONY

    Operating margin (operating income as a ratio of revenues) for Apple, Nintendo and SONY
    Operating margin (operating income as a ratio of revenues) for Apple, Nintendo and SONY

    Read our report on Japan’s electronics industry sector

    Japan electronics industries – mono zukuri

    Copyright (c) 2008-2013 Eurotechnology Japan KK All Rights Reserved

  • Today’s APPLE 4th quarter results vs NINTENDO

    Today’s APPLE 4th quarter results vs NINTENDO

    A few hours ago (Oct 22, 2008, 6am Tokyo Time) APPLE announced 4th Quarter and Full Year results – we are here updating our comparison between APPLE and NINTENDO. With 6.9 million iPhones sold in APPLE’s 4th Quarter (July + August + September 2008), APPLE has achieved 2.76% market share of all mobile phones globally.

    APPLE strongly accelerates lead over NINTENDO in term of sales (see figure below) – even more dramatically, if we take into account that the iPhone in 4th Quarter now accounts for 39% of APPLE’s sales. APPLE accounts for iPhone sales in terms of a subscription model over two years because of free software updates for iPhones. If we would use APPLE’s non-GAAP figures, which book iPhone sales fully at the point of sale, then APPLE’s sales lead over NINTENDO would be even stronger.

    In terms of margins we see the opposite trend: NINTENDO‘s lead over APPLE in terms of higher margins expands (see below).

    Watch our interview about APPLE’s 4Q results today 11:50am (Tokyo time) on CNBC as a video clip.

    Apple accelerated lead over Nintendo in terms of revenues.

    Apple’s lead would be more dramatic if correcting for Apple’s subscription model used for iPhone sales according to GAAP rules.

    Annual revenues, operating income and net income of Apple vs Nintendo
    Annual revenues, operating income and net income of Apple vs Nintendo

    While Apple’s lead over Nintendo in terms of sales is growing, Nintendo’s lead in terms of operating margins is expanding.

    Operating margins: Apple vs Nintendo
    Operating margins: Apple vs Nintendo

    Copyright (c) 2013 Eurotechnology Japan KK All Rights Reserved

  • Games: Nintendo – the winner takes it all

    Games: Nintendo – the winner takes it all

    Game industries in total are MUCH bigger than music industries… in Japan game industries are about 10 times bigger business than music industries… Last weekend we had the Tokyo Game Show – read some key points below! From 2006 Japan’s game sector changed dramatically- Nintendo created several paradigm shifts, and “took off”. Read more about Nintendo driven paradigm shifts below. US games giant Electronic Arts (EA) would rank 5th in sales, was EA Japanese. Japan’s games industries are big!

    Nintendo income takes off: Nintendo broke the PC-style race for faster machines, and broke out of the limited market of hard core gamers. From FY 2007 Nintendo’s income takes off:

    Operating income for Japan's  game  companies
    Operating income for Japan’s game companies

    Nintendo’s DS: braintraining instead of shooting.

    SONY’s PSP goes for power, and Nintendo’s DS changed the paradigm + went for lower price. By the way, we see a shift from TV video games to portable and mobile phone games in terms of numbers: for current 7th generation game platforms portables outsell TV video consoles 2:1. DS’s success encouraged Nintendo to develop the Wii.

    sales of SONY-PSP vs Nintendo DS in Japan and globally
    sales of SONY-PSP vs Nintendo DS in Japan and globally

    Avoid the dinosaurs:

    global sales of Nintendo Wii, SONY Playstation PS3, and Microsoft Xbox-360

    “Too many powerful consoles are like ferocious dinosaurs. They might fight and hasten their own exinction” (Nintendo’s Shigeru Miyamoto in an interview). Nintendo’s Wii has much less power, lower screen resolution, and is much cheaper to make and cheaper to buy than PS3 and Xbox360. Nintendo makes money on every Wii sold.

    Sales of Nintendo-Wii vs SONY-PSP vs Microsoft XBOX
    Sales of Nintendo-Wii vs SONY-PSP vs Microsoft XBOX

    Report: “Nintendo and Japan’s games industries” (9th edition, 181 pages, release October 15, 2008, pdf-file for download):

    Eurotechnology report on Nintendo and Japan's game industry
    Eurotechnology report on Nintendo and Japan’s game industry

    Copyright (c) 2013 Eurotechnology Japan KK All Rights Reserved

  • Paradigm change of the global mobile phone business and opportunities for Japanese mobile phone makers

    Presentation at the CEATEC Conference, talk NT-13, Meeting Room 302, International Conference Hall, Makuhari Messe, Friday October 3, 2008, 11:00-12:00.

    See the announcement here [in English] and in Japanese [世界の携帯電話市場のパラダイム変更と日本の携帯電話メーカーのチャンス]

    The emergence of iPhone, Android, open-sourcing of Symbian, and the growth of mobile data services are changing the paradigm of the global mobile phone business opening new opportunities for Japanese mobile phone makers. Japan’s mobile phone handset makers have missed most opportunities during the first wave of mobile phone opportunities. The developing paradigm change opens new opportunities for Japanese makers. The talk will explain the paradigm shifts and trends of the global mobile phone handset market, and resulting opportunities for Japanese mobile phone makers, and will indicate how these opportunities can actually be realized.

    Copyright 2013 Eurotechnology Japan KK All Rights Reserved

  • XBOX Japan entry

    XBOX Japan entry

    XBOX still faces difficulties in Japan

    XBOX Japan entry: Microsoft reduces prices by 30%

    Microsoft announced to reduce prices for Xbox-360 by 30% in Japan. We believe that this price reduction will not be enough to bring the breakthrough for Xbox in Japan.

    Nintendo has reinvented the game industry, created a completely new paradigm. Nintendo does not reduce prices. Xbox is still in the pre-paradigm shift world… prices are not the issue.

    Japan game market report (398 pages, pdf-file):

    XBOX Japan entry: CNBC interview

    Copyright 2013 Eurotechnology Japan KK All Rights Reserved

  • XBOX Japan strategy – Microsoft still struggling

    XBOX Japan strategy – Microsoft still struggling

    Microsoft XBOX introduced XBOX to Japan on February 22, 2002

    XBOX Japan Strategy – CNBC interview

    Microsoft introduced the original XBOX game console in the USA on November 15, 2001, in Japan on February 22, 2002, and in Europe on March 14, 2002.

    During the period January-June 2005, three years after introduction of the XBOX to Japan’s market, SONY sold about 2.4 Million game terminals in Japan, Nintendo sold about 1.9 Million, and Microsoft about 9000 XBOXes, about 0.2% marketshare.

    As of August 24, 2008, Nintendo has sold about 6.7 Million Wii, SONY has sold about 2.3 PS3, and Microsoft about 380,000 XBOX-360 in Japan, a 4% share in this segment.

    A few days ago, Microsoft announced a price cut of 30% for XBOX-360 in Japan – the video below gives our comments on this price reduction on CNBC.

    Here is a short summary of the CNBC-TV interview:

    XBOX Japan Strategy Question: Do you think the price reduction is going to do the trick?

    A: No. In other markets maybe, but not in Japan.

    XBOX Japan Strategy Question: Do you think XBOX can be successful in Japan? What will it take before Microsoft will give up and say it just isn’t working

    A: Of course Microsoft can be successful in Japan with XBOX. There is no law that XBOX cannot be successful in Japan. Microsoft generally is a company that never gives up. But they have to change their strategy for Japan.

    XBOX Japan Strategy Question: So Microsoft isn’t doing the right things. What would the right things be?

    A: Difficult to say of course, if it was easy Microsoft would already have done this. The situation is that Nintendo has completely changed the business paradigm of the game industry. Microsoft’s XBOX is still operating under the old paradigm.

    XBOX Japan Strategy Question: How long do you think Nintendo’s sweetspot is going to last?

    A: Nintendo have reinvented the game industry, and completely changed the business models. They also make a lot of their own software. All this puts Nintendo into a very good position.

    What can we learn about strategy for Japan from Microsoft’s XBOX experience:

    Global products, not adapted to Japan’s market, often do not succeed in Japan. Microsoft’s XBOX is a very good example. Microsoft has one of Japan’s most famous brands, so its not a problem of the brand.

    Microsoft faces three problems in Japan:

    1. XBOX is not made for Japanese users in mind
    2. Nintendo changed the paradigm of the game industry, and XBOX is still on the old track
    3. Of three global game console companies (Nintendo, SONY, Nintendo) two are both much stronger than Microsoft in games, and both are on their hometurf in Japan. Microsoft would need to invest more and focus efforts much more on Japan to succeed in Japan with XBOX.

    Japan game market disruption market report:

    Japan game market report (398 pages, pdf-file):

    Copyright (c) 2013 Eurotechnology Japan KK All Rights Reserved