Toshiba’s income restatement announced by the independent 3rd party committee
Independent 3rd party committee chaired by former Chief Prosecutor of Tokyo High Court
On 12 June, 2015, Toshiba announced corrections to income reports, and at the same time engaged an independent 3rd party investigation committee headed by former Chief Prosecutor at the Tokyo High Court, Mr Ueda, to investigate. This independent 3rd party committee submitted their report yesterday, and held a Press Conference this evening.
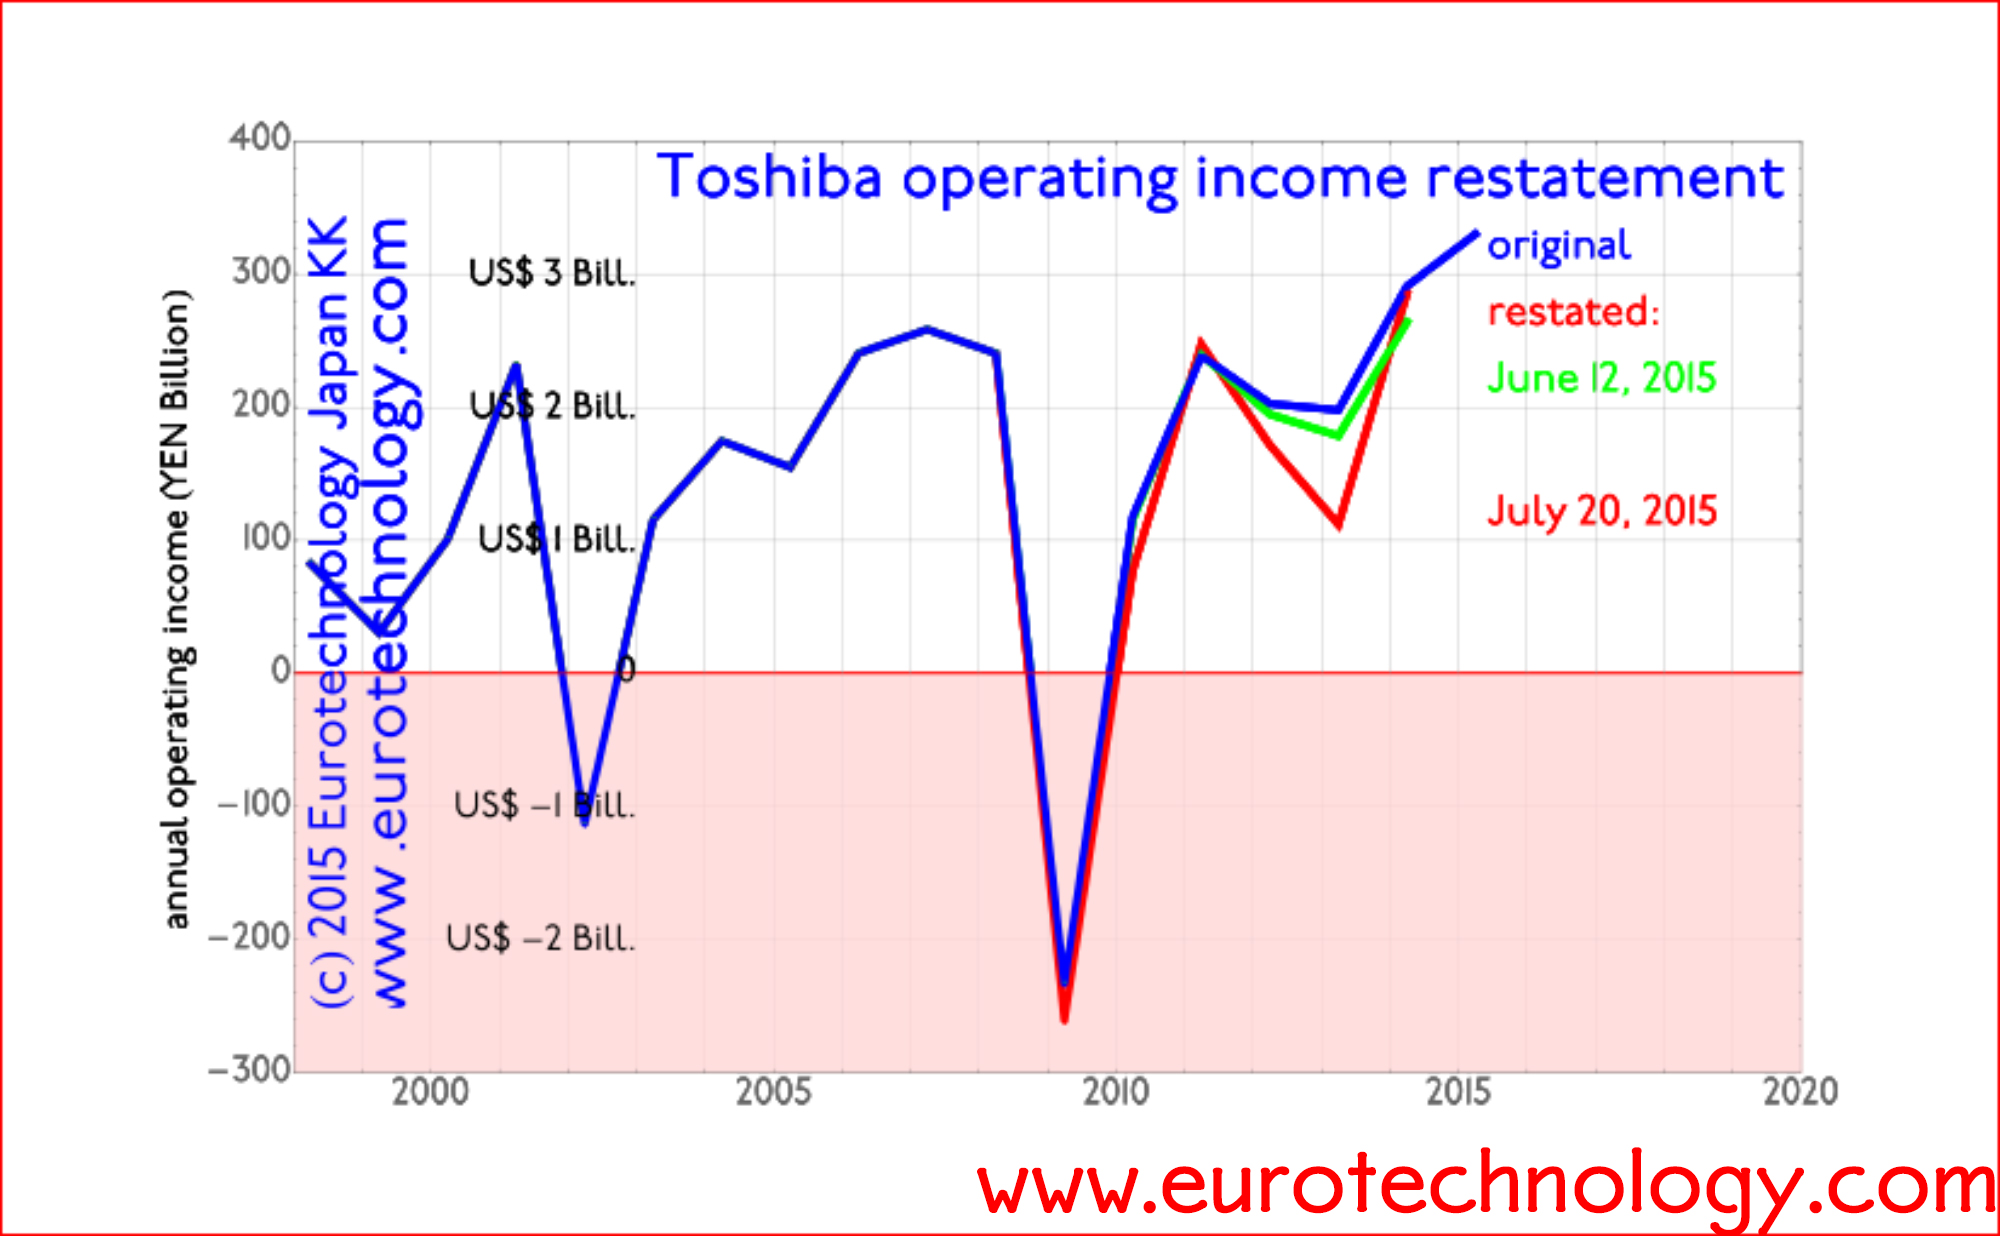
Lets look at the announced Toshiba financial data in detail. The figure below shows:
- Toshiba’s previously reported operating income/profits (blue curve),
- corrections announced by an internal committee on June 12, 2015 (green curve),
- corrections announced by the independent 3rd party committee on July 20, 2015 (red curve).
The combined amount of downward corrections determined by the independent 3rd party committee is YEN 151.8 billion (US$ 1.22 billion) in total.
Lets put this amount into context:
- annual sales: approx. YEN 6000 billion (US$ 60 billion)
- annual operating income (average over last 17 years): YEN 148 billion (US$ 1.5 billion)
- annual net income (average over last 17 years): YEN 19 billion (US$ 190 million)
Therefore the downward correction summed over the years corresponds to:
- approx. 2.5% of average annual sales
- approx. 103% of average annual operating profits, ie more than a full year of average operating profits
- approx. 8 years of net profits
Toshiba – typical for Japan’s large electronics corporations – operates with razor-thin profit margins: Toshiba’s net profit margin averaged over the last 17 years is 0.25%.
Therefore, the downward correction corresponds to 8 years of average net income/profits.

- Blue curve shows Toshiba’s initially reported operating income.
- Green curve shows corrections determined by an internal examination, announced on June 12, 2015. Corrections amount to approx. YEN 50 billion (= approx. US$ 0.5 billion).
- Red curve shows corrections determined by the independent 3rd party commission, chaired by former Tokyo High Court Chief Prosecutor Ueda and announced on July 20, 2015. Corrections amount to YEN 151.8 billion (= approx. US$ 1.22 billion)
Japan electronics industries – mono zukuri
Copyright (c) 2009-2019 Eurotechnology Japan KK All Rights Reserved