Tag: radiation

  • Fukushima disaster impact on Tokyo [5]: Radiation risk situation for Tokyo, Business risk impact

    Fukushima disaster impact on Tokyo [5]: Radiation risk situation for Tokyo, Business risk impact

    5th update on the crisis in Tokyo, focusing on radiation and business impact

    Fukushima nuclear accident impact on Tokyo, 12 April 2011

    This is our 5th update on the crisis in Tokyo, focusing mainly on the radiation and impact on business in Japan.

    The continuing quakes (as shown below) do present risk. To my knowledge, earth quakes are “chaotic” (mathematically speaking), and there is considerable scientific argument that earth quakes cannot be reliably predicted. More in a future newsletter.

    The Japanese Government has classified the Fukushima Dai-Ichi accident as a level 7 accident in the INES Scale. The official Japanese Government documents announcing this INES Scale classification can be found here in Japanese and here in English. Note however, that we are dealing here with nature, and human reactions. Nature does not care how we classify such accidents.

    Damaged Fukushima reactors are “static” but not yet stable

    Gregory Jaczko, Chairman of the US Nuclear Regulatory Commission on April 11, 2011 reported to the US Senate, that the condition of the damaged reactors is ” ‘static’, but with improvised cooling efforts, they are not ‘stable’ “.

    Rebuilding is progressing at amazing speed. The Tohoku Shinkansen high-speed train was re-opened Tokyo-Fukushima yesterday, with relay train connections on regular track to Sendai. The full Tokyo-Shin-Aomori line is scheduled to open beginning of May. ANA has started to fly to the repaired Sendai airport.

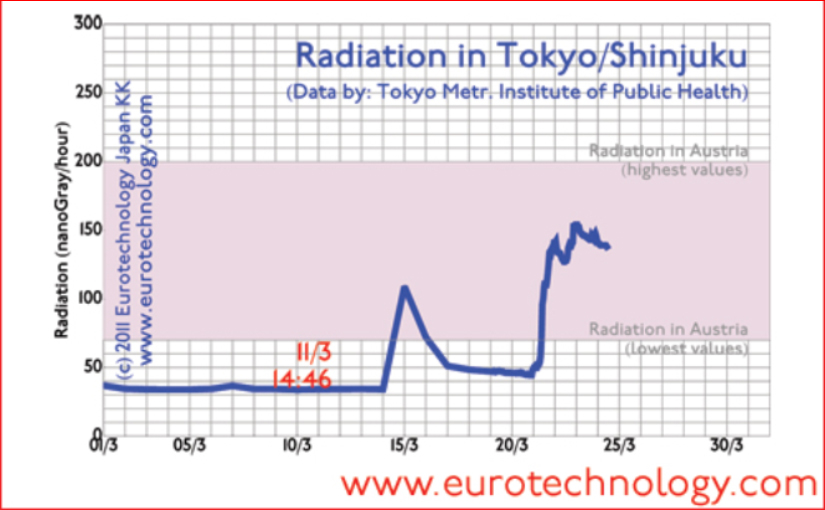
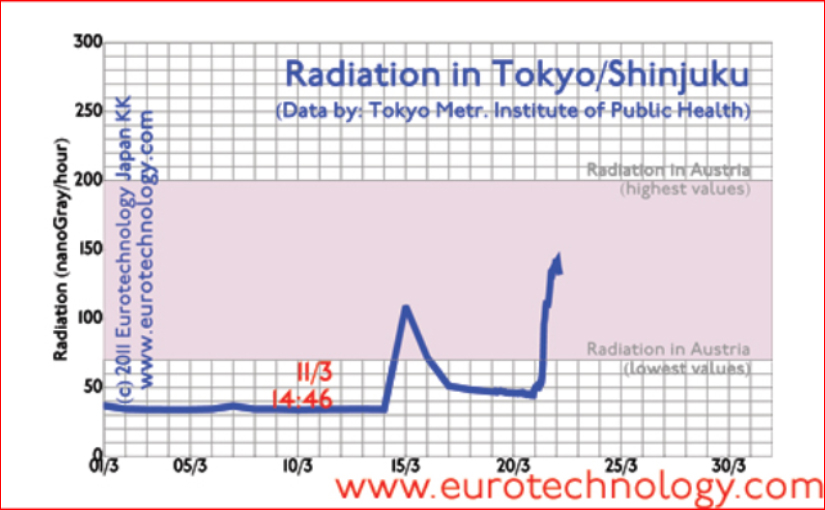
    Radiation measurement results for Tokyo are shown below. Measured radiation levels in Tokyo are now comparable to Austria, and there are many places on earth which have far higher levels than are reported for Tokyo now.

    Quakes and after-quakes

    The figures show that more than 300 earthquakes of magnitude 5 or larger occurred since the major quake on March 11, 2011 at 14:46. The epicenters of quakes lie mostly where the Pacific Plate moves under the North American Plate on which Tohoku lies.

    According to our knowledge earth quakes are mathematically speaking a “chaotic” phenomenon, and scientific arguments are, that it is difficult if not impossible to predict earth quakes with precision. (Figure: Wolfram Alpha LLC)

    Earth quakes of magnitude 5 and greater in Japan (March-April 2011) (Figure: Wolfram Alpha LLC)
    Earth quakes of magnitude 5 and greater in Japan (March-April 2011) (Figure: Wolfram Alpha LLC)
    Earth quakes of magnitude 5 and greater in Japan (March-April 2011) on logarithmic magnitude scale (Figure: Wolfram Alpha LLC)
    Earth quakes of magnitude 5 and greater in Japan (March-April 2011) on logarithmic magnitude scale (Figure: Wolfram Alpha LLC)

    Analyzing radiation levels in Tokyo/Shinjuku

    Radiation in Tokyo/Shinjuku (until April 13, 2011) compared to Austria
    Radiation in Tokyo/Shinjuku (until April 13, 2011) compared to Austria

    Radiation levels in Tokyo (Shinjuku and Shibuya) and Tsukuba:

    Radiation in Tsukuba (until April 13, 2011) compared to Austria
    Radiation in Tsukuba (until April 13, 2011) compared to Austria

    The blue curve above shows the radiation levels in Tokyo/Shinjuku as measured and published by the Tokyo Metropolitan Institute for Public Health here:

    • each hour for the last 24 hours
    • daily starting March 1

    The red curves show maximum and minimum data as measured by TEPCO in Tokyo-Shibuya, and published here: TEPCO radiation data

    The green curves show radiation data measured by Japan’s highly respected AIST Laboratory in Tsukuba (Ibaraki-ken, about 60 km north of Tokyo in direction of Fukushima) and published here: AIST radiation data.

    Radiation levels in Tsukuba

    The green curves show radiation data measured by AIST Laboratory in Tsukuba (Ibaraki-ken, about 60 km north of Tokyo in direction of Fukushima) and published here: AIST radiation data.

    The radiation measurement results in Tsukuba are considerably higher than found in Tokyo, but have in the last few days decreased close to the top levels found naturally in Austria and in many other countries.

    The differences in the data between Tokyo and Tsukuba could be because Tsukuba is 60km closer to Fukushima, could be cause by weather conditions, but they could also be caused by differences in the measurement equipment or a combination of these factors.

    Drinking water (tap water) in Tokyo:

    Contamination of Tokyo tap water with I-131 (until April 13, 2011)
    Contamination of Tokyo tap water with I-131 (until April 13, 2011)

    Analysis of tap water in Tokyo can be found here for each day starting with March 18. This analysis shows that Tokyo tap water currently contains some radioactive Iodine (I-131), and some Cesium (CS-134 and Cs-137) radioactive isotopes.

    Interesting in this context is that according to a WHO report on Japan of March 22 (pdf-file), Japanese health limits for radioactive Iodine are about 10 times lower than global standards, ie if Japanese health limits are exceeded, the levels are still at 10% of global limits (we don’t intend to underestimate this problem however).

    We conclude that currently radioactive Iodine (I-131) concentrations are about 0.2% of Japan’s limits set by Japan’s Nuclear Safety Commission, and about 0.02% of international health limits, and are currently on a downward trend.

    Contamination of tap water with Cesium Cs-134 and CS-137 isotopes (until April 13, 2011)
    Contamination of tap water with Cesium Cs-134 and CS-137 isotopes (until April 13, 2011)

    Radioactive contamination of drinking water (Cesium)

    Cesium contamination with radioactive Cs-134 (1/2-life = 2.1 years) and Cs-137 (1/2-life = 30 years) isotopes is currently on the order of 0.1% of the limits set by Japan’s Nuclear Safety Commission and are on a downward trend.

    The relatively long 1/2-life of Cesium-134 and Cesium-137 means that these radioactive isotopes will stay with us for many years. To understand this situation it is necessary to compare these levels with natural levels, and with other sources of radioactivity, and how Cesium interacts with our bodies.

    Where to find radiation measurement results (updated March 28, 2011):

    Japan’s Government AIST laboratory:
    http://www.aist.go.jp/taisaku/ja/measurement/index.html

    Japan’s Science and Education Ministry MEXT publishes regional radiation data:
    http://www.mext.go.jp/a_menu/saigaijohou/index.htm
    http://www.mext.go.jp/english/radioactivity_level/
    These data are graphically shown here:
    Radiation: http://atmc.jp/
    Drinking water: http://atmc.jp/water/
    Rain water: http://atmc.jp/ame/

    Radiation data for Tokyo/Shinjuku are published here:
    each hour for the last 24 hours
    for each day starting March 1

    Copyright (c) 2013 Eurotechnology Japan KK All Rights Reserved

  • Fukushima nuclear disaster impact on Tokyo [4]

    Fukushima nuclear disaster impact on Tokyo [4]

    Radiation levels in Tokyo

    Fukushima nuclear disaster impact on Tokyo update No. 4 of 28 March 2011

    Fukushima nuclear disaster impact on Tokyo: This is our 4th update on the crisis in Tokyo, focusing mainly on the radiation and impact on business in Japan. Our future expert newsletters will discuss earth quakes.

    Despite all the suffering, we believe there could be a positive impact on Japan’s economy, if the current crisis leads to regulatory reform, structural reform and decentralization of Japan, see our TV interview on BBC and on AlJazeera.

    Friday 25th March I discussed the situation directly with top officials of Japan’s Technology, Science and Education Ministry MEXT, which is responsible for official radiation measurements across all regions of Japan. I talked also with the Department Head responsible for radiation measurements about some open points, e.g. why the official Government measurements and the TEPCO measurements differ.

    Generally speaking the situation at the Fukushima nuclear power station is still dangerous and may continue to be so for some time, however, reports seem to indicate that progress is continuously made moving into the right direction. We will discuss the radiation situation in Tokyo, which is slowly improving according to our understanding of the data available to us. We will discuss more details in future newsletters.

    Analyzing radiation levels in Tokyo/Shinjuku

    Radiation levels in Tokyo in March 2011 compared to background in Austria
    Radiation levels in Tokyo in March 2011 compared to background in Austria

    Radiation levels in Tokyo (Shinjuku and Shibuya) and Tsukuba

    The blue curve above shows the radiation levels in Tokyo/Shinjuku as measured and published by the Tokyo Metropolitan Institute for Public Health here:
    each hour for the last 24 hours
    daily starting March 1
    The red curves show maximum and minimum data as measured by TEPCO in Tokyo-Shibuya, and published here: TEPCO radiation data

    The green curves show radiation data measured by Japan’s highly respected AIST Laboratory in Tsukuba (Ibaraki-ken, about 60 km north of Tokyo in direction of Fukushima) and published here: AIST radiation data. AIST is a highly respected research laboratory, and we believe that these measurements are conducted with much professional diligence and suitable equipment by experienced scientists.

    It is astonishing that radiation data in Tokyo, Shinjuku measured by the Tokyo Metropolitan Government under coordination of Japan’s MEXT-Ministry differ substantially from the results by TEPCO in Shibuya just a few kilometers away. Currently (morning of March 28), Tokyo Government’s data are 110 nGray/h, while TEPCO’s data a few km away are 59 nGray/h, about one half. We believe that the two groups measuring these data should meet and search for an understanding of this difference.

    We see a strong radiation peak which occurred around March 15 in all data. Currently the radiation levels in Tokyo are in the range of natural background radiation found in Austria and many other countries on our planet. Radiation levels are decreasing.

    If there is no further emergency and no further leakage of radiation from the Fukushima plant, we would expect radiation to drop closer to normal background levels, however this depends on weather conditions.

    It is important to keep in mind however, that the radiation levels in the Figure above are due to radioactive isotopes, mainly Iodine (I-131, I-133), and Cesium (CS-134, CS-137), but also Tellurium (Te-132), Xenon (Xe-133) (for a detailed analysis see the AIST data). Detailed impact on people depends on how these isotopes enter the body and whether they remain inside the body, and which organs they affect.

    Another factor is 1/2-life. Radioactive isotopes decay with time via emission of radiation, in the case of I-131 8 days, I-132 2.3 hours, and I-133 21 hours. Therefore the Iodine isotopes disappear naturally after a few days, while Cs-134 (1/2-life 2.1 years), Cs-137 (1/2-life 30 years) stay around for a long time.

    Radiation data in Tsukuba and Tokyo in March 2011
    Radiation data in Tsukuba and Tokyo in March 2011

    Radiation levels in Tsukuba: The green curves show radiation data measured by AIST Laboratory in Tsukuba (Ibaraki-ken, about 60 km north of Tokyo in direction of Fukushima) and published here: AIST radiation data.

    The radiation measurement results in Tsukuba are considerably higher than found in Tokyo, but have in the last few days decreased close to the top levels found naturally in Austria and in many other countries.

    The differences in the data between Tokyo and Tsukuba could be because Tsukuba is 60km closer to Fukushima, could be cause by weather conditions, but they could also be caused by differences in the measurement equipment or a combination of these factors.

    Drinking water (tap water) in Tokyo

    Radioactive contamination of drinking water in Tokyo (Iodine)

    Contamination of tap water for I-131 (until March 27)
    Contamination of tap water for I-131 (until March 27)

    Analysis of tap water in Tokyo can be found here for each day starting with March 18. This analysis shows that Tokyo tap water currently contains some radioactive Iodine (I-131), and some Cesium (CS-134 and Cs-137) radioactive isotopes.

    Interesting in this context is that according to a WHO report on Japan of March 22 (pdf-file), Japanese health limits for radioactive Iodine are about 10 times lower than global standards, ie if Japanese health limits are exceeded, the levels are still at 10% of global limits (we don’t intend to underestimate this problem however).

    We conclude that currently radioactive Iodine (I-131) concentrations are about 7% of Japan’s limits set by Japan’s Nuclear Safety Commission, and about 0.7% of international health limits, and are currently on a downward trend.

    According to US Ambassador Roos, US Government experts are currently analyzing the Tokyo tap water situation and will report on their findings shortly.

    Radioactive contamination of drinking water (Cesium)

    Contamination of tap water for Cs-134 and Cs-137 (until March 27)
    Contamination of tap water for Cs-134 and Cs-137 (until March 27)

    Cesium contamination with radioactive Cs-134 (1/2-life = 2.1 years) and Cs-137 (1/2-life = 30 years) isotopes is currently on the order of 0.2% and 0.4% of the limits set by Japan’s Nuclear Safety Commission and are on a downward trend.

    The relatively long 1/2-life of Cesium-134 and Cesium-137 means that these radioactive isotopes will stay with us for many years. To understand this situation it is necessary to compare these levels with natural levels, and with other sources of radioactivity, and how Cesium interacts with our bodies.

    Copyright (c) 2013 Eurotechnology Japan KK All Rights Reserved

  • Fukushima disaster impact on Tokyo – Update No. 3

    Fukushima disaster impact on Tokyo – Update No. 3

    Radiation fall-out on Tokyo

    3rd update of 24 March 2011

    This is our third update on the crisis situation in Tokyo, focusing mainly on the radiation risk, and impact on business in Japan. Strong after-quakes are still continuing everyday, more than 300 after-quakes stronger than magnitude 5 were counted since the initial magnitude 9 quake on March 11, 2011 at 14:46.

    Loss of human lives (more than 20,000), evacuation (more than 300,000 evacuees), electricity shortages and factory closures have impact on the global supply chains and will impact the GDP of Japan, however we believe there could be a positive impact on Japan’s competitiveness if this crisis leads to structural changes and deregulation in Japan – for details see our interview on BBC.

    In the initial phase of the earthquakes mobile phone communications were very unreliable, with voice connections unavailable, and mobile mail connections almost unavailable even in Tokyo, only one mail out of 10-20 attempts could be sent. 3426 mobile phone base stations are reported to be out of action as of March 22 (for an overview of mobile communications including details of base stations see our JCOMM report). SNS on the other hand (Twitter, Facebook, Mixi, GREE etc) were resilient, and we expect their popularity to increase even further because of the quake. Several Japanese Government agencies and Electrical Utility TEPCO started using Twitter the first time a few days after the quake.

    Analyzing radiation levels in Tokyo/Shinjuku

    Radiation levels in Tokyo in March 2011
    Radiation levels in Tokyo in March 2011

    Comparing radiation levels in Tokyo/Shinjuku with Austria:

    The blue curve above shows the radiation levels in Tokyo/Shinjuku as measured and published by the Tokyo Metropolitan Institute for Public Health here:
    each hour for the last 24 hours
    daily starting March 1
    Before the earthquake on March 11, 2011 at 14.46, radiation data were around 34 nanoGray/hour. Around March 15 and since March 21 increases to the range of 130 – 150 nanoGray/hour where measured. It is generally assumed that these increases are due to radioactive isotopes carried from the Fukushima Nuclear Power station due to wind and weather conditions.

    Our Figure shows that radiation levels measured in Tokyo seem to have stabilized with a downward trend. So there maybe some hope for radiation levels to return to normally low levels if the downward trend continues.

    To put these radiation levels into context, we compare these radiation levels in the Figure above with the radiation levels naturally found in Austria. The Austrian umweltnet.at website shows current radiation levels in Austria, and mentions that natural radiation levels in Austria are between 70 and 200 nano-Sievert/hour, which corresponds to 70 – 200 nanoGray/hour. We indicate this range above in pink color.

    This Figure shows that according to our interpretation, radiation levels in Tokyo/Shinjuku were about 30% lower than the lowest radiation levels found in Austria, and are currently increased to levels which would be in mid-range of natural radiation in Austria (natural radiation is mainly caused by Radon gas diffusing out from the ground, and from the natural cosmic radiation from space). Humans have been exposed to this natural background radiation ever since life exists on earth, and Darwinian evolution of human live has taken place in coexistence with this natural background radiation, and in the natural presence of a corresponding amount of radioactive isotopes.

    It is important to keep in mind however, that the radiation levels in the Figure above are due to radioactive isotopes, mainly Iodine (I-131, I-133), and Cesium (CS-134, CS-137), but also Tellurium (Te-132), Xenon (Xe-133) (for a detailed analysis see the AIST data). Detailed impact on people depends on how these isotopes enter the body and whether they remain inside the body, and which organs they affect.

    Another factor is 1/2-life. Radioactive isotopes decay with time via emission of radiation, in the case of I-131 8 days, I-132 2.3 hours, and I-133 21 hours. Therefore the Iodine isotopes disappear naturally after a few days, while Cs-134 (1/2-life 2.1 years), Cs-137 (1/2-life 30 years) stay around for a long time.

    Drinking water

    Analysis of tap water in Tokyo can be found here for each day starting with March 18. This analysis shows that Tokyo tap water currently contains some radioactive Iodine (I-131), and some Cesium (Cs-137).

    Interesting in this context is that according to a WHO report on Japan of March 22 (pdf-file), Japanese health limits for radioactive Iodine are about 10 times lower than global standards, ie if Japanese health limits are exceeded, the levels are still at 10% of global limits (we don’t intend to underestimate this problem however). According to US Ambassador Roos, US Government experts are currently analyzing the Tokyo tap water situation and will report on their findings shortly.

    Our short analysis of the radiation data for Tsukuba and Shinjuku:

    Gray, Gy, microGray, nanoGray measure the absorption of ionizing radiation. One Gray is the the absorption of one Joule (the unit of energy) by one kilogram of matter, see: http://en.wikipedia.org/wiki/Gray_(unit)

    Sv, Sievert, uSievert refers to the impact of radiation on biological tissue, not to the physics of the radiation itself, see: http://en.wikipedia.org/wiki/Sievert
    For X-rays and Gamma-rays (which are high-energy X-rays) the units are the same, ie one microGray has the impact of one microSievert, the conversion factor is 1.

    You can see that in Tsukuba the radiation impact on humans over the last days has been on the order of 40 – 300 nano-Sieverts/hour, which is oscillating around the natural range of radiation in Austria.

    The radiation measurements in Tokyo-Shinjuku showed around 50 nano-Sieverts/hour most of the time, except for spikes above 100 nano-Sieverts/hour.

    Click here to see that radiation levels in Austria are in the range of 70 – 200 nano-Gray/hour (corresponding to 70 – 200 nano-Siever/hour for Gamma-Rays).

    This means that the radiation levels in Tsukuba are currently similar or a little higher than you would typically experience in higher regions of Austria, while the radiation levels in Tokyo-Shinjuku currently at mid-range for Austria, and have been 30% lower than the lowest radiation levels in Austria for much of the time since the quake. We have made similar comparisons for Italy. The natural background radiation load in Austria and Italy (and other countries) are due to (1) radon gas which emerges from the ground and produced by the decay of natural Uranium, and (2) cosmic radiation from space, which are all exposed to anywhere on earth. Cosmic radiation exposure is higher at high altitudes, since cosmic radiation is screened by the atmosphere.

    We conclude that currently radiation levels in the Tokyo region are of similar magnitude as in typical European countries.

    Note however, that the radiation levels currently in Tokyo are due to radioactive isotopes which may be inhaled or ingested and remain inside the human body, so there is a difference to natural background radiation. We may analyze this point in future newsletters.

    Regarding radiation, please note that radiation is not equal radiation, there are
    alpha (= Helium nuclei),
    beta (= electrons e.g. inside vacumm TV tubes and old fashioned PC terminals) and
    gamma rays (= high energy X-rays),
    neutrons, and other types or radiation (e.g. neutrinos).

    When people talk about “radiation” from the Nuclear power station, they don’t usually mean the direct alpha, beta, gamma radiation or neutrons, which cannot travel far, but they mean radioactive isotopes which are the product of radioactive decay. The harmful nature of radio-active isotopes depends very much on the type of isotope, and specially also their half-life, and whether they are attached externally to clothing or shoes, or whether they are inhaled or eaten and remain in the body. Some decay very fast, and others live very long. Some, like plutonium are also very poisonous in addition to radioactivity.

    The Tsukuba AIST website analyzes the isotopes in detail and lists the occurance as a function of time, as well as the 1/2-life. Shorter 1/2-life (ie I-132: 2.3 hours) mean higher radioactivity, but also mean that such short-lived isotopes also disappear faster.

    Further information on radiation levels in Japan, CTBTO data:

    It turns out that according to an article in NATURE, the Comprehensive Nuclear-Test-Ban Treaty Organization (CTBTO) is collecting and transmitting very detailed data on radioactivity and composition of radio-nucleides in and around Japan, but it keeping these data secret.

    CTBTO radiation data have now been analyzed by the Austrian Central Agency for Weather and Geodynamics (“Hohe Warte”), and conclude that the release of radioactive isotopes by the Fukushima powerstations corresponds to approximately 20% of the amounts released in the Chernobyl accident. For a short report including animations of the spread of the radioactive plume see here http://www.zamg.ac.at/aktuell/index.php?seite=1&artikel=ZAMG_2011-03-23GMT10:57 .

    Copyright (c) 2013 Eurotechnology Japan KK All Rights Reserved

  • Radiation in Tokyo: Fukushima disaster update No. 2

    Radiation in Tokyo: Fukushima disaster update No. 2

    Radiation in Tokyo due to the Fukushima nuclear disaster

    Our second update of the radiation and disaster situation in Tokyo, as of 22 March 2011

    Suffering caused by the Friday March 11, 14:46 earthquake in Japan continues, but we see hope and reconstruction. Tomorrow the new high-speed train line north of the disaster zone is planned to run again between Shin-Aomori and Morioka. Radiation in Tokyo is evolving due to the Fukushima disaster and explosions and melt-down of nuclear reactors.

    Japan’s society has developed over 100s of years coping with similar disasters, and it is already obvious that Japan will overcome this disaster strengthened. In recent years, Japan overcame the Kobe-Earthquake and the Niigata-Earthquake, and Japan will also overcome this earthquake soon. We observe many discussions to learn from this disaster and to strengthen Japan.

    In this newsletter we focus on analysis of radiation risks (see below) in Tokyo, and on US and EU response.

    Radiation in Tokyo: situation in Tokyo

    Radiation in Tokyo is evolving due to the Fukushima disaster and explosions and melt-down of nuclear reactors
    Radiation in Tokyo is evolving due to the Fukushima disaster and explosions and melt-down of nuclear reactors

    We see Japanese companies and Japanese workers – including our company Eurotechnology-Japan here in Tokyo – working almost normally throughout the period of after-quakes. A notable exception is the account settlement IT system of Mizuho-Bank which apparently has broken down.

    Electricity savings by the population were beyond expectations, so that planned electricity cuts have been largely avoided – most electricity cuts were announced but not implemented – the electricity keeps flowing in most areas, especially in the central areas.

    While many long-term foreign residents remained in Tokyo, a large fraction of temporary foreigners left either to Osaka, or left Japan altogether.
    The departure of some foreigners (and some Japanese) has not been un-noticed.

    One of my friends, Japanese surgeon (medical doctor) at Tokyo University’s hospital, who had stayed at the bedside of patients throughout the quake, broke down in tears telling me about a colleague leaving Tokyo during the after-quakes.

    US actions – Operation Tomodachi

    “Operation Tomodachi”: The US Pacific Command has built up a massive help and relief effort “Operation Tomodachi”, which involves US Air Force, US Marine Corps, US Army (458 personell + 1000 contractors), US Navy (12,750 personell participating in Operation Tomodachi). A summary of US Pacific Command help to Japan including “Operation Tomodachi” can be found here. In particular, US experts and loaned equipment are helping with the Fukushima nuclear power stations, US is working to repair Sendai Airport and other damaged infrastructure so that supplies can be forwarded, and US military is delivering supplies including food, blankets, fuel and water into the disaster area.

    According to announcements by the US Ambassador Roos, the US Embassy in Tokyo has increased staffing by about 30%, and 96 US Government employees and experts have arrived from outside Japan to help.

    EU actions

    EU response: summarized here on the EU website .

    Many EU country Embassies have reduced staff or shut down in Tokyo. (This is in stark contrast to the actions of the US Embassy in Japan, which actually increased staff numbers).

    Situation at the Fukushima Reactor

    Through heroic work of the fire fighters at the reactors the situation seems to stabilize and improve in the right direction. The International Atomic Energy Agency website summarizes the the situation officially here dated March 20, 2011. It appears that since March 20 the situation has improved further.

    We here at Eurotechnology-Japan are continously working here in Tokyo for you – and our customers. We actually closed new business contracts a few days after the March 11 earthquake.

  • Understanding radiation in Tokyo: Japan crisis update No. 1

    Understanding radiation in Tokyo: Japan crisis update No. 1

    Understanding radiation in Tokyo as a consequence of the Fukushima nuclear disaster

    Sources of radiation information and analysis as of 18 March 2011

    On Friday March 11, at 14:46 one of the world’s largest earthquakes ever happened close to Japan’s coast near Fukushima, triggering a series of disasters which are still ongoing, and which brought much suffering. Human suffering continues, after-quakes continue – for a full week we had 20 or more after-quakes every day, some also quite strong, including several during the production of this newsletter. Understanding radiation in Tokyo has become a key factor for decision making by government, companies and population

    We will interview one of the world’s most important earthquake experts in one of our next newsletter.

    In this edition we focus on the radiation issues from the nuclear power station disaster

    For an assessment of the situation at the Fukushima nuclear power stations, you may be interested to read a report of March 15, 2011 by the UK Government’s Chief Scientific Officer Professor John Beddington.

    Our understanding of Japan’s radiation situation

    Japan’s Government AIST laboratory (which is METI’s largest laboratory and it’s competence and R&D results are very respected for a long time) is publishing radiation measurements taken in their Tsukuba laboratory directly, and include analysis of the radiation (Tsukuba is in Ibaraki-ken north of Tokyo in direction of the Fukushima nuclear power station – so we expect radiation in Tsukuba to be higher than in Tokyo) – you can find them here: http://www.aist.go.jp/taisaku/ja/measurement/index.html

    Japan’s Science and Education Ministry publishes radiation data for the last 24 hours for all of Japan here: http://atmc.jp/

    Radiation data for Tokyo/Shinjuku are published here

    each hour for the last 24 hours

    for each day starting March 1

    Our short analysis of the radiation data for Tsukuba and Shinjuku

    Sv, Sievert, uSievert refer to the impact on the body by radiation, not to the physics of the radiation itself, which is measured with different units. find details here: http://en.wikipedia.org/wiki/Sievert

    You can see that in Tsukuba the radiation impact on humans is currently on the order of 0.08 – 0.10 micro-Sieverts/hour.

    The radiation measurements in Tokyo-Shinjuku show around 0.05 micro-Sieverts/hour

    Click here to see that radiation levels in Austria are in the range of 0.07 – 0.2 micro-Sieverts/hour.

    This means that the radiation levels in Tsukuba are currently the same as you would typically experience in Austria, while the radiation levels in Tokyo-Shinjuku currently are about 30% lower than the lowest radiation levels in Austria, and about 4 times lower than the highest radiation levels in Austria. We have made similar comparisons for Italy.

    We conclude that currently radiation levels in the Tokyo region are of similar magnitude or lower than in typical European countries.

    Regarding radiation, please note also that radiation is not equal radiation, there are

    • alpha (= Helium nuclei),
    • beta (= electrons e.g. inside vacumm TV tubes and old fashioned PC terminals) and
    • gamma rays (= high energy X-rays),
    • neutrons,
    • and other types or radiation (e.g. neutrinos).

    When people talk about “radiation” from the Nuclear power station, they don’t usually mean the direct alpha, beta, gamma radiation or neutrons, which cannot travel far, but they mean radioactive ions. The harmful nature of radio-active ions depends very much on what kind of ions these are, and specially also their half-life, and whether they are attached externally to clothing or shoes, or whether they are inhaled or eaten and remain in the body. Some decay very fast, and others live very long. Some, like plutonium are also very poisonous in addition to radioactivity.

    Further information on radiation levels in Japan

    It turns out that according to an article in NATURE, the Comprehensive Nuclear-Test-Ban Treaty Organization (CTBTO) is collecting and transmitting very details data on radioactivity and composition of radio-nucleides in and around Japan, but it keeping these data secret.

    We do not know the reasons why it is necessary to keep CTBTO’s measured data about radiation in Japan secret during this disaster. If anybody reads this newsletter familar with CTBTO’s conditions – maybe this person could urge the publication of these radiation data.