Lets benchmark three iconic companies:
Apple Nintendo Sony
Apple Nintendo Sony: three iconic companies evolving along very different paths. Apple’s current physical products famously all fit onto a single mid-sized table. Nintendo’s current physical products as well, for SONY you’d need a warehouse.
- APPLE: Wednesday October 22 APPLE announced spectacular full-year results with a year-on-year net income increase of 38%. The results are even better than they look, because iPhone sales and income are spread forward over 2 years due to accounting rules. (See our comments on CNBC here)
- NINTENDO: on August 29, 2008 Nintendo revised the forecast for full-year net income upward by +26.2% (See our comments on CNBC here)
- SONY: in contrast, on October 23, 2008, SONY said that full-year net income (for the financial year ending March 2009) is expected to be 37.5% lower than previously predicted (see our comments on SONY’s 1Q results here on CNBC)
Apple Nintendo Sony – Lets look at today’s market caps:
- APPLE market cap = US$ 85.6 Billion (about 4 x SONY)
- NINTENDO market cap = US$ 37.2 Billion (about 2 x SONY)
- SONY market cap = US$ 19.9 Billion
Apple Nintendo Sony – Why this dramatic difference in market caps? We believe its focus.
Apple and Nintendo are companies with clear focus. Lets look at the details below:
Comparing revenues (sales):
SONY = 3 x APPLE
SONY = 4 x NINTENDO

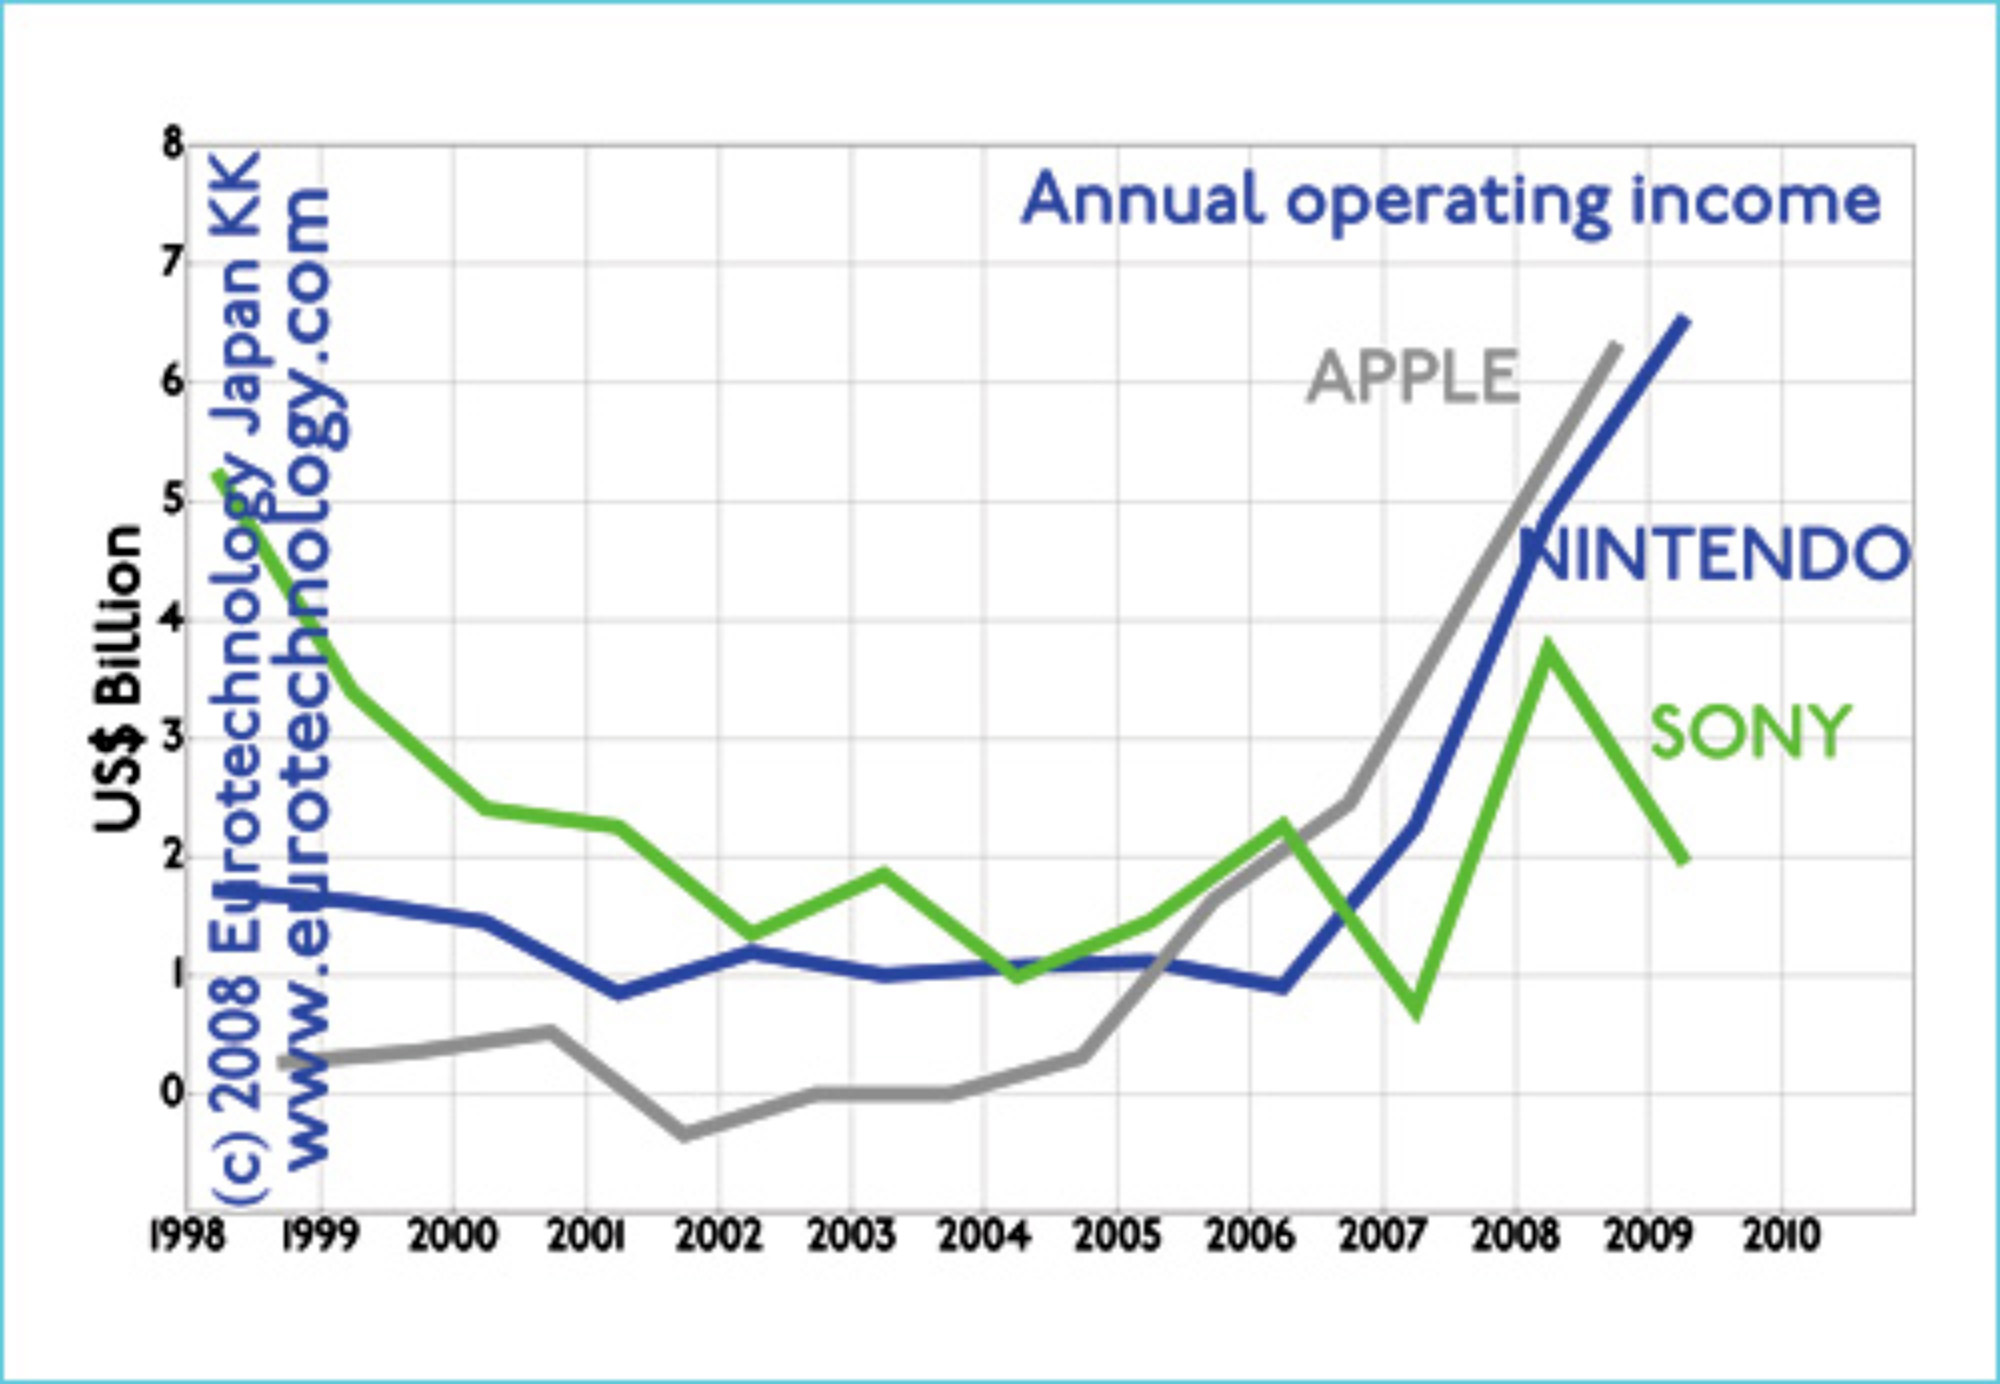
Comparing annual operating income:
APPLE = 3 x SONY
NINTENDO = 3 x SONY

Comparing operating margin:
APPLE = 9 x SONY
NINTENDO = 15 x SONY

Read our report on Japan’s electronics industry sector
Japan electronics industries – mono zukuri
Copyright (c) 2008-2013 Eurotechnology Japan KK All Rights Reserved
Comments and discussions