Radiation levels in Tokyo
Fukushima nuclear disaster impact on Tokyo update No. 4 of 28 March 2011
Fukushima nuclear disaster impact on Tokyo: This is our 4th update on the crisis in Tokyo, focusing mainly on the radiation and impact on business in Japan. Our future expert newsletters will discuss earth quakes.
Despite all the suffering, we believe there could be a positive impact on Japan’s economy, if the current crisis leads to regulatory reform, structural reform and decentralization of Japan, see our TV interview on BBC and on AlJazeera.
Friday 25th March I discussed the situation directly with top officials of Japan’s Technology, Science and Education Ministry MEXT, which is responsible for official radiation measurements across all regions of Japan. I talked also with the Department Head responsible for radiation measurements about some open points, e.g. why the official Government measurements and the TEPCO measurements differ.
Generally speaking the situation at the Fukushima nuclear power station is still dangerous and may continue to be so for some time, however, reports seem to indicate that progress is continuously made moving into the right direction. We will discuss the radiation situation in Tokyo, which is slowly improving according to our understanding of the data available to us. We will discuss more details in future newsletters.
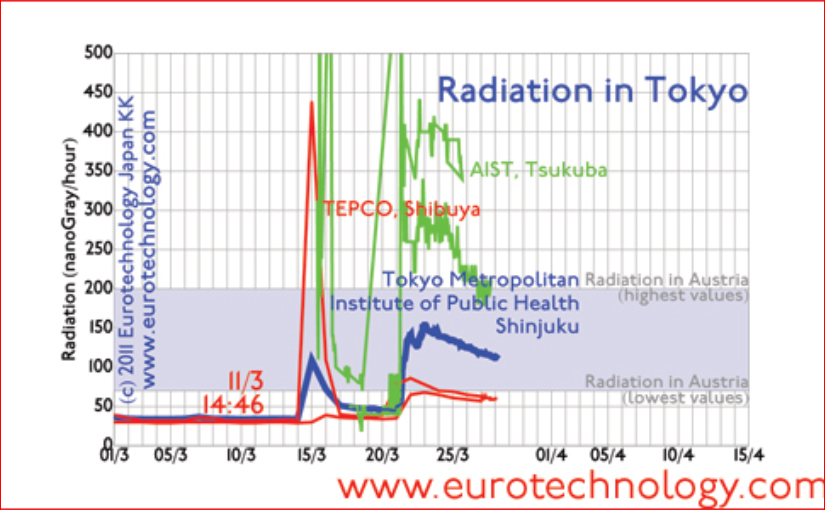
Analyzing radiation levels in Tokyo/Shinjuku

Radiation levels in Tokyo (Shinjuku and Shibuya) and Tsukuba
The blue curve above shows the radiation levels in Tokyo/Shinjuku as measured and published by the Tokyo Metropolitan Institute for Public Health here:
each hour for the last 24 hours
daily starting March 1
The red curves show maximum and minimum data as measured by TEPCO in Tokyo-Shibuya, and published here: TEPCO radiation data
The green curves show radiation data measured by Japan’s highly respected AIST Laboratory in Tsukuba (Ibaraki-ken, about 60 km north of Tokyo in direction of Fukushima) and published here: AIST radiation data. AIST is a highly respected research laboratory, and we believe that these measurements are conducted with much professional diligence and suitable equipment by experienced scientists.
It is astonishing that radiation data in Tokyo, Shinjuku measured by the Tokyo Metropolitan Government under coordination of Japan’s MEXT-Ministry differ substantially from the results by TEPCO in Shibuya just a few kilometers away. Currently (morning of March 28), Tokyo Government’s data are 110 nGray/h, while TEPCO’s data a few km away are 59 nGray/h, about one half. We believe that the two groups measuring these data should meet and search for an understanding of this difference.
We see a strong radiation peak which occurred around March 15 in all data. Currently the radiation levels in Tokyo are in the range of natural background radiation found in Austria and many other countries on our planet. Radiation levels are decreasing.
If there is no further emergency and no further leakage of radiation from the Fukushima plant, we would expect radiation to drop closer to normal background levels, however this depends on weather conditions.
It is important to keep in mind however, that the radiation levels in the Figure above are due to radioactive isotopes, mainly Iodine (I-131, I-133), and Cesium (CS-134, CS-137), but also Tellurium (Te-132), Xenon (Xe-133) (for a detailed analysis see the AIST data). Detailed impact on people depends on how these isotopes enter the body and whether they remain inside the body, and which organs they affect.
Another factor is 1/2-life. Radioactive isotopes decay with time via emission of radiation, in the case of I-131 8 days, I-132 2.3 hours, and I-133 21 hours. Therefore the Iodine isotopes disappear naturally after a few days, while Cs-134 (1/2-life 2.1 years), Cs-137 (1/2-life 30 years) stay around for a long time.

Radiation levels in Tsukuba: The green curves show radiation data measured by AIST Laboratory in Tsukuba (Ibaraki-ken, about 60 km north of Tokyo in direction of Fukushima) and published here: AIST radiation data.
The radiation measurement results in Tsukuba are considerably higher than found in Tokyo, but have in the last few days decreased close to the top levels found naturally in Austria and in many other countries.
The differences in the data between Tokyo and Tsukuba could be because Tsukuba is 60km closer to Fukushima, could be cause by weather conditions, but they could also be caused by differences in the measurement equipment or a combination of these factors.
Drinking water (tap water) in Tokyo
Radioactive contamination of drinking water in Tokyo (Iodine)

Analysis of tap water in Tokyo can be found here for each day starting with March 18. This analysis shows that Tokyo tap water currently contains some radioactive Iodine (I-131), and some Cesium (CS-134 and Cs-137) radioactive isotopes.
Interesting in this context is that according to a WHO report on Japan of March 22 (pdf-file), Japanese health limits for radioactive Iodine are about 10 times lower than global standards, ie if Japanese health limits are exceeded, the levels are still at 10% of global limits (we don’t intend to underestimate this problem however).
We conclude that currently radioactive Iodine (I-131) concentrations are about 7% of Japan’s limits set by Japan’s Nuclear Safety Commission, and about 0.7% of international health limits, and are currently on a downward trend.
According to US Ambassador Roos, US Government experts are currently analyzing the Tokyo tap water situation and will report on their findings shortly.
Radioactive contamination of drinking water (Cesium)

Cesium contamination with radioactive Cs-134 (1/2-life = 2.1 years) and Cs-137 (1/2-life = 30 years) isotopes is currently on the order of 0.2% and 0.4% of the limits set by Japan’s Nuclear Safety Commission and are on a downward trend.
The relatively long 1/2-life of Cesium-134 and Cesium-137 means that these radioactive isotopes will stay with us for many years. To understand this situation it is necessary to compare these levels with natural levels, and with other sources of radioactivity, and how Cesium interacts with our bodies.
Copyright·©2013 ·Eurotechnology Japan KK·All Rights Reserved·
Comments and discussions